388 W 3rd St Mansfield, OH 44903
Estimated Value: $75,000 - $150,000
4
Beds
2
Baths
2,548
Sq Ft
$44/Sq Ft
Est. Value
About This Home
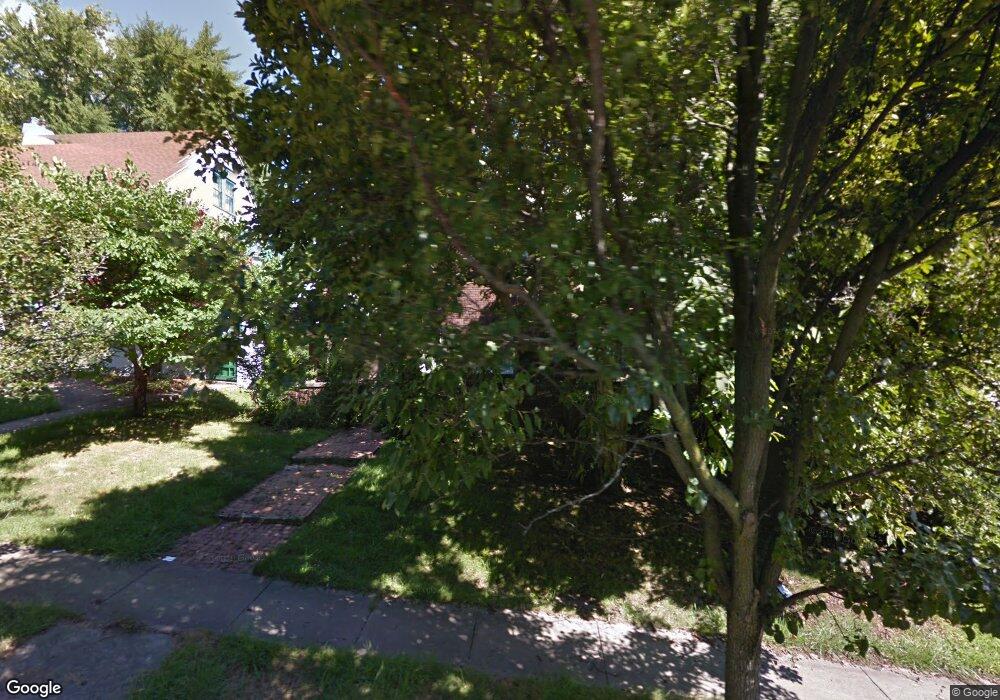
This home is located at 388 W 3rd St, Mansfield, OH 44903 and is currently estimated at $111,667, approximately $43 per square foot. 388 W 3rd St is a home located in Richland County with nearby schools including Goal Digital Academy, Mansfield Elective Academy, and St. Peter's High School/Junior High.
Ownership History
Date
Name
Owned For
Owner Type
Purchase Details
Closed on
Aug 28, 2018
Sold by
Bunting John E
Bought by
Brown Diana L
Current Estimated Value
Purchase Details
Closed on
Sep 23, 1996
Sold by
Henry Patrica H
Bought by
Bunting Cynthia L
Home Financials for this Owner
Home Financials are based on the most recent Mortgage that was taken out on this home.
Original Mortgage
$44,000
Interest Rate
7.93%
Mortgage Type
New Conventional
Create a Home Valuation Report for This Property
The Home Valuation Report is an in-depth analysis detailing your home's value as well as a comparison with similar homes in the area
Home Values in the Area
Average Home Value in this Area
Purchase History
| Date | Buyer | Sale Price | Title Company |
|---|---|---|---|
| Brown Diana L | $12,000 | None Available | |
| Bunting Cynthia L | $20,000 | -- |
Source: Public Records
Mortgage History
| Date | Status | Borrower | Loan Amount |
|---|---|---|---|
| Previous Owner | Bunting Cynthia L | $44,000 |
Source: Public Records
Tax History Compared to Growth
Tax History
| Year | Tax Paid | Tax Assessment Tax Assessment Total Assessment is a certain percentage of the fair market value that is determined by local assessors to be the total taxable value of land and additions on the property. | Land | Improvement |
|---|---|---|---|---|
| 2024 | $923 | $19,720 | $2,400 | $17,320 |
| 2023 | $923 | $19,720 | $2,400 | $17,320 |
| 2022 | $901 | $16,130 | $2,320 | $13,810 |
| 2021 | $907 | $16,130 | $2,320 | $13,810 |
| 2020 | $928 | $16,130 | $2,320 | $13,810 |
| 2019 | $1,029 | $16,130 | $2,320 | $13,810 |
| 2018 | $1,014 | $16,130 | $2,320 | $13,810 |
| 2017 | $987 | $16,130 | $2,320 | $13,810 |
| 2016 | $1,198 | $18,980 | $5,890 | $13,090 |
| 2015 | $1,144 | $18,980 | $5,890 | $13,090 |
| 2014 | $1,129 | $18,980 | $5,890 | $13,090 |
| 2012 | $453 | $19,980 | $6,200 | $13,780 |
Source: Public Records
Map
Nearby Homes