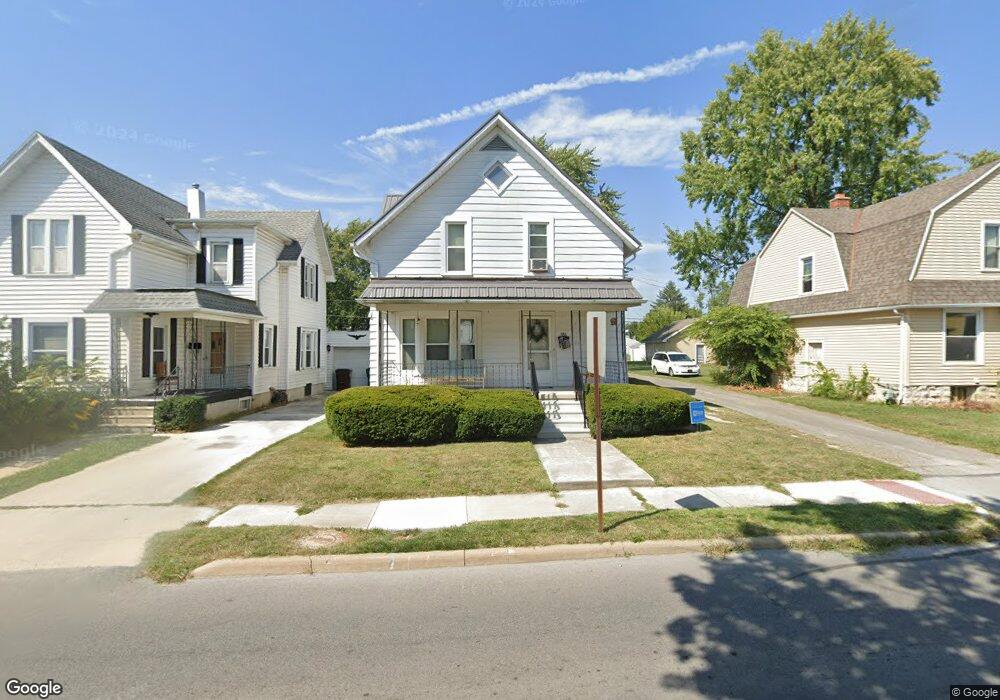
388 W Perry St Tiffin, OH 44883
Estimated Value: $123,000 - $144,000
3
Beds
2
Baths
1,436
Sq Ft
$96/Sq Ft
Est. Value
About This Home
This home is located at 388 W Perry St, Tiffin, OH 44883 and is currently estimated at $137,478, approximately $95 per square foot. 388 W Perry St is a home located in Seneca County with nearby schools including Columbian High School, North Central Academy - Fremont, and Calvert Catholic Elementary School.
Ownership History
Date
Name
Owned For
Owner Type
Purchase Details
Closed on
Jun 10, 2006
Sold by
The Board Of Trustte Of The Ohio Distric
Bought by
King Rex E and King Deborah L
Current Estimated Value
Home Financials for this Owner
Home Financials are based on the most recent Mortgage that was taken out on this home.
Original Mortgage
$50,000
Outstanding Balance
$32,534
Interest Rate
6.72%
Mortgage Type
New Conventional
Estimated Equity
$104,944
Purchase Details
Closed on
Jun 9, 2006
Sold by
King Rex E and King Deborah L
Bought by
Craig Michelle M
Home Financials for this Owner
Home Financials are based on the most recent Mortgage that was taken out on this home.
Original Mortgage
$50,000
Outstanding Balance
$32,534
Interest Rate
6.72%
Mortgage Type
New Conventional
Estimated Equity
$104,944
Purchase Details
Closed on
Jul 10, 2000
Bought by
King Rex E
Create a Home Valuation Report for This Property
The Home Valuation Report is an in-depth analysis detailing your home's value as well as a comparison with similar homes in the area
Home Values in the Area
Average Home Value in this Area
Purchase History
| Date | Buyer | Sale Price | Title Company |
|---|---|---|---|
| King Rex E | -- | None Available | |
| Craig Michelle M | $50,000 | None Available | |
| King Rex E | $44,000 | -- |
Source: Public Records
Mortgage History
| Date | Status | Borrower | Loan Amount |
|---|---|---|---|
| Open | King Rex E | $50,000 | |
| Closed | Craig Michelle M | $50,000 |
Source: Public Records
Tax History Compared to Growth
Tax History
| Year | Tax Paid | Tax Assessment Tax Assessment Total Assessment is a certain percentage of the fair market value that is determined by local assessors to be the total taxable value of land and additions on the property. | Land | Improvement |
|---|---|---|---|---|
| 2024 | $1,139 | $33,740 | $3,700 | $30,040 |
| 2023 | $1,140 | $33,740 | $3,700 | $30,040 |
| 2022 | $1,050 | $25,780 | $3,220 | $22,560 |
| 2021 | $1,057 | $25,780 | $3,220 | $22,560 |
| 2020 | $1,077 | $25,775 | $3,217 | $22,558 |
| 2019 | $1,042 | $24,119 | $3,087 | $21,032 |
| 2018 | $1,044 | $24,119 | $3,087 | $21,032 |
| 2017 | $983 | $24,119 | $3,087 | $21,032 |
| 2016 | $921 | $21,585 | $2,993 | $18,592 |
| 2015 | $911 | $21,585 | $2,993 | $18,592 |
| 2014 | $858 | $21,585 | $2,993 | $18,592 |
| 2013 | $917 | $22,239 | $3,087 | $19,152 |
Source: Public Records
Map
Nearby Homes
- 39 Cherry St
- 29 Virginia Ave
- 115 Lindsay Ave
- 169 Nelson St
- 0 Miami St Unit 20242078
- 0 Miami St Unit Parcel 2 6116475
- 225 W Perry St
- 314 S Sandusky St
- 0 Township Road 198a Unit 20242098
- 0 Township Road 198a Unit Parcel 4
- 2695 Ohio 18
- 0 W Market St
- 365 Benner St
- 28 Orange St
- 17 Franklin St
- 50 Clay St
- 48 Clay St
- 215 Hudson St
- 221 Beechwood Dr
- 190 Hall St