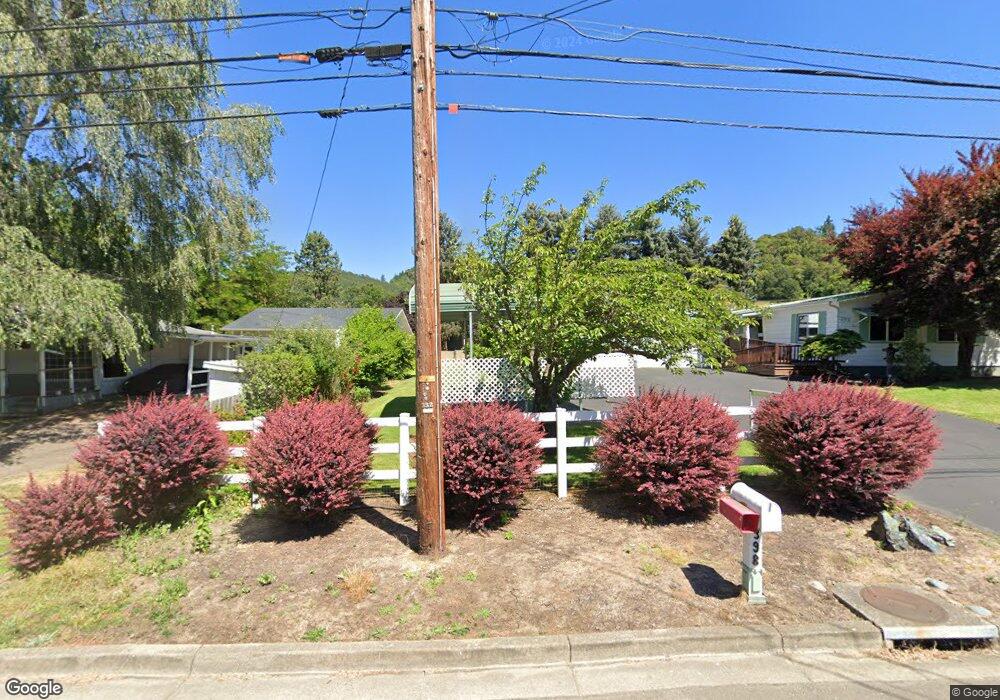
388 Weaver Ave Myrtle Creek, OR 97457
Estimated Value: $258,715 - $286,000
2
Beds
1
Bath
988
Sq Ft
$280/Sq Ft
Est. Value
About This Home
This home is located at 388 Weaver Ave, Myrtle Creek, OR 97457 and is currently estimated at $276,179, approximately $279 per square foot. 388 Weaver Ave is a home located in Douglas County with nearby schools including South Umpqua High School.
Ownership History
Date
Name
Owned For
Owner Type
Purchase Details
Closed on
Oct 29, 2008
Sold by
Haarstad Alice and Lyon Joseph R
Bought by
Haarstad Alice and Semrau Albert
Current Estimated Value
Purchase Details
Closed on
Aug 25, 2008
Sold by
Mcelmurry Kyle and Williams Clifford G
Bought by
Mcelmurry Kyle
Home Financials for this Owner
Home Financials are based on the most recent Mortgage that was taken out on this home.
Original Mortgage
$80,000
Interest Rate
6.59%
Mortgage Type
New Conventional
Create a Home Valuation Report for This Property
The Home Valuation Report is an in-depth analysis detailing your home's value as well as a comparison with similar homes in the area
Home Values in the Area
Average Home Value in this Area
Purchase History
| Date | Buyer | Sale Price | Title Company |
|---|---|---|---|
| Haarstad Alice | -- | None Available | |
| Mcelmurry Kyle | -- | First American Els |
Source: Public Records
Mortgage History
| Date | Status | Borrower | Loan Amount |
|---|---|---|---|
| Closed | Mcelmurry Kyle | $80,000 |
Source: Public Records
Tax History Compared to Growth
Tax History
| Year | Tax Paid | Tax Assessment Tax Assessment Total Assessment is a certain percentage of the fair market value that is determined by local assessors to be the total taxable value of land and additions on the property. | Land | Improvement |
|---|---|---|---|---|
| 2025 | $1,496 | $157,374 | -- | -- |
| 2024 | $1,456 | $152,791 | -- | -- |
| 2023 | $1,412 | $148,341 | $0 | $0 |
| 2022 | $1,380 | $144,021 | $0 | $0 |
| 2021 | $1,333 | $139,827 | $0 | $0 |
| 2020 | $1,296 | $135,755 | $0 | $0 |
| 2019 | $1,269 | $131,801 | $0 | $0 |
| 2018 | $1,234 | $127,963 | $0 | $0 |
| 2017 | $1,135 | $124,236 | $0 | $0 |
| 2016 | $1,083 | $120,618 | $0 | $0 |
| 2015 | $1,058 | $117,105 | $0 | $0 |
| 2014 | $1,074 | $113,695 | $0 | $0 |
| 2013 | -- | $82,730 | $0 | $0 |
Source: Public Records
Map
Nearby Homes
- 207 Henry St
- 333 S Old Pacific Hwy
- 434 S Old Pacific Hwy
- 135 Crest Dr
- 172 S Old Pacific Hwy
- 187 October Dr
- 131 Mountain View Ave
- 166 Peacock Ln
- 711 Plin St
- 115 W Ridge Ln
- 107 Wanda Ct
- 781 Plin St
- 239 Arrow Way
- 231 Arrow Way
- 424 Aker Dr
- 115 Duane Ct
- 317 Aker Dr
- 1955 Weaver Rd
- 135 Market Ln
- 1721 Weaver Rd