Estimated Value: $220,000 - $262,000
3
Beds
2
Baths
1,350
Sq Ft
$176/Sq Ft
Est. Value
About This Home
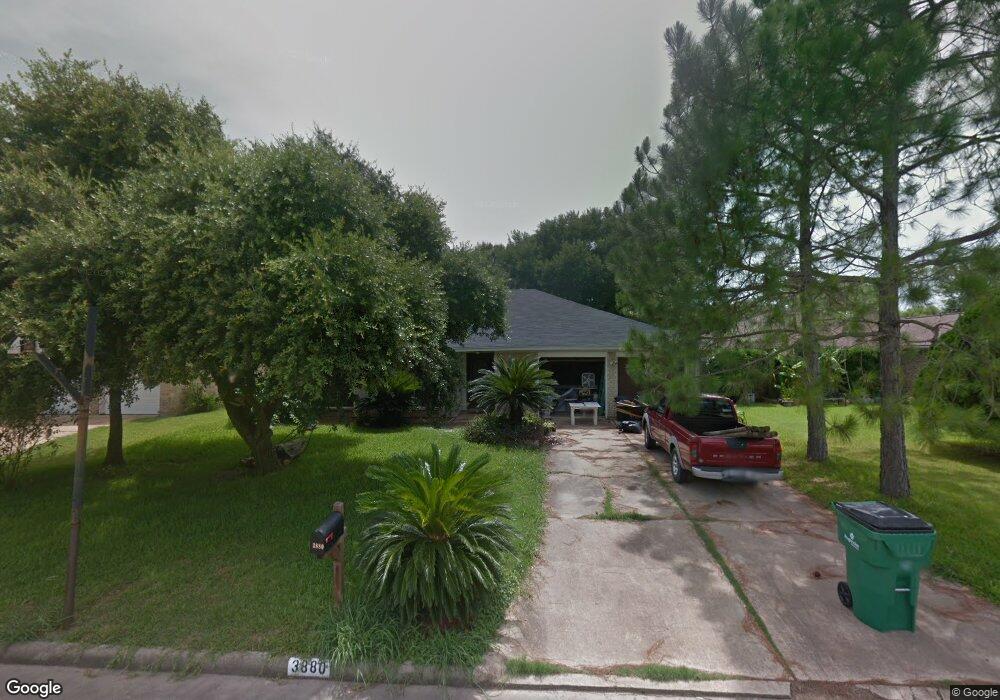
This home is located at 3880 Clover Dr, Alvin, TX 77511 and is currently estimated at $237,764, approximately $176 per square foot. 3880 Clover Dr is a home located in Brazoria County with nearby schools including R.L. Stevenson Primary School, Alvin Junior High School, and Alvin High School.
Ownership History
Date
Name
Owned For
Owner Type
Purchase Details
Closed on
Jan 16, 2015
Sold by
Hernandez Richard I and Hernandez Raquel M
Bought by
Dunn Charles B
Current Estimated Value
Home Financials for this Owner
Home Financials are based on the most recent Mortgage that was taken out on this home.
Original Mortgage
$111,200
Outstanding Balance
$85,456
Interest Rate
3.93%
Mortgage Type
New Conventional
Estimated Equity
$152,308
Purchase Details
Closed on
Aug 28, 2000
Sold by
Gardner Janice Lynn
Bought by
Hernandez Richard and Hernandez Raquel M
Home Financials for this Owner
Home Financials are based on the most recent Mortgage that was taken out on this home.
Original Mortgage
$79,540
Interest Rate
8.21%
Purchase Details
Closed on
Jan 20, 1998
Sold by
Castle Hugh Wayne and Castle Della Loraine
Bought by
Gardner Janice Lynn
Home Financials for this Owner
Home Financials are based on the most recent Mortgage that was taken out on this home.
Original Mortgage
$70,775
Interest Rate
7.16%
Create a Home Valuation Report for This Property
The Home Valuation Report is an in-depth analysis detailing your home's value as well as a comparison with similar homes in the area
Home Values in the Area
Average Home Value in this Area
Purchase History
| Date | Buyer | Sale Price | Title Company |
|---|---|---|---|
| Dunn Charles B | -- | Stewart Title | |
| Hernandez Richard | -- | -- | |
| Gardner Janice Lynn | -- | -- |
Source: Public Records
Mortgage History
| Date | Status | Borrower | Loan Amount |
|---|---|---|---|
| Open | Dunn Charles B | $111,200 | |
| Previous Owner | Hernandez Richard | $79,540 | |
| Previous Owner | Gardner Janice Lynn | $70,775 |
Source: Public Records
Tax History Compared to Growth
Tax History
| Year | Tax Paid | Tax Assessment Tax Assessment Total Assessment is a certain percentage of the fair market value that is determined by local assessors to be the total taxable value of land and additions on the property. | Land | Improvement |
|---|---|---|---|---|
| 2025 | $3,349 | $222,277 | $19,640 | $202,960 |
| 2023 | $3,349 | $183,700 | $19,640 | $175,360 |
| 2022 | $4,581 | $167,000 | $19,640 | $147,360 |
| 2021 | $4,545 | $157,410 | $18,130 | $139,280 |
| 2020 | $4,366 | $149,180 | $18,130 | $131,050 |
| 2019 | $4,321 | $143,850 | $15,110 | $128,740 |
| 2018 | $4,000 | $132,950 | $15,110 | $117,840 |
| 2017 | $4,133 | $135,640 | $15,110 | $120,530 |
| 2016 | $4,133 | $135,640 | $15,110 | $120,530 |
| 2014 | $2,753 | $101,040 | $15,110 | $85,930 |
Source: Public Records
Map
Nearby Homes
- 3810 Westglen Dr
- 1145 Westglen Dr
- 3925 Larkspur St
- 300 Mustang Rd
- 369 Windsor Square
- 610 Linda Ln
- 111 Fairway Dr
- 607 Debbie Ln
- 201 W Timberlane Dr
- 3200 Fairway Dr
- 336 Paso Fino Dr
- 3111 Paso Fino Dr
- 3221 County Road 890
- 00 Highway 6
- 1751 Rosharon Rd
- 0 W Highway 6 Unit 68293296
- 204 Hillcrest Dr
- 205 Hillcrest Dr
- 394 Sherandoe Ln
- 210 Hillcrest Dr
- 3870 Clover Dr
- 3890 Clover Dr
- 3875 Jasmine Dr
- 3860 Clover Dr
- 3900 Clover Dr
- 3885 Jasmine Dr
- 3875 Clover Dr
- 3855 Jasmine Dr
- 3895 Jasmine Dr
- 3850 Clover Dr
- 3845 Jasmine Dr
- 000 Wildwinn Dr
- 3865 Clover Dr
- 3835 Jasmine Dr
- 3855 Clover Dr
- 3880 Jasmine Dr
- 3886 Larkspur St
- 3845 Clover Dr
- 3890 Jasmine Dr
- 1110 Wildwinn Dr