Estimated Value: $682,000 - $850,292
6
Beds
3
Baths
3,848
Sq Ft
$198/Sq Ft
Est. Value
About This Home
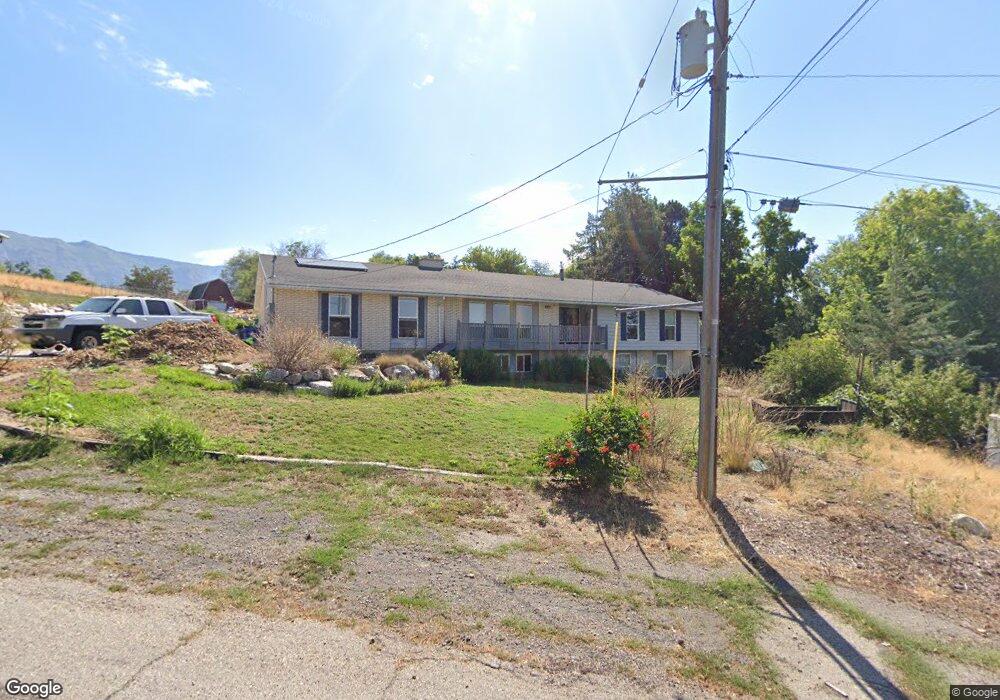
This home is located at 3880 Price Ln, Ogden, UT 84414 and is currently estimated at $761,073, approximately $197 per square foot. 3880 Price Ln is a home located in Weber County with nearby schools including Lomond View School, Orion Junior High School, and Weber High School.
Ownership History
Date
Name
Owned For
Owner Type
Purchase Details
Closed on
Jun 9, 2020
Sold by
Muirbrook Cody C and Muirbrook Kelsie M
Bought by
Muirbrook Cody Charles and Muirbrook Kelsie Marie
Current Estimated Value
Purchase Details
Closed on
Apr 3, 2007
Sold by
Wright Vonda Ladeen
Bought by
Satterthwaite Jonathan C and Satterthwaite Emily
Home Financials for this Owner
Home Financials are based on the most recent Mortgage that was taken out on this home.
Original Mortgage
$200,000
Outstanding Balance
$120,592
Interest Rate
6.1%
Mortgage Type
Purchase Money Mortgage
Estimated Equity
$640,481
Purchase Details
Closed on
Jun 13, 2001
Sold by
Donoviel Thelma K and Humiston Diane
Bought by
Wright Wayne G and Wright Vonda Ladeen
Home Financials for this Owner
Home Financials are based on the most recent Mortgage that was taken out on this home.
Original Mortgage
$130,000
Interest Rate
7.14%
Create a Home Valuation Report for This Property
The Home Valuation Report is an in-depth analysis detailing your home's value as well as a comparison with similar homes in the area
Home Values in the Area
Average Home Value in this Area
Purchase History
| Date | Buyer | Sale Price | Title Company |
|---|---|---|---|
| Muirbrook Cody Charles | -- | None Available | |
| Satterthwaite Jonathan C | -- | Equity Title Layton | |
| Wright Wayne G | -- | -- | |
| Wright Wayne G | -- | -- |
Source: Public Records
Mortgage History
| Date | Status | Borrower | Loan Amount |
|---|---|---|---|
| Open | Satterthwaite Jonathan C | $200,000 | |
| Previous Owner | Wright Wayne G | $130,000 | |
| Closed | Wright Wayne G | $50,000 |
Source: Public Records
Tax History Compared to Growth
Tax History
| Year | Tax Paid | Tax Assessment Tax Assessment Total Assessment is a certain percentage of the fair market value that is determined by local assessors to be the total taxable value of land and additions on the property. | Land | Improvement |
|---|---|---|---|---|
| 2025 | $5,220 | $794,174 | $213,306 | $580,868 |
| 2024 | $4,723 | $407,482 | $95,798 | $311,684 |
| 2023 | $4,128 | $355,235 | $95,799 | $259,436 |
| 2022 | $4,436 | $388,850 | $81,565 | $307,285 |
| 2021 | $3,941 | $581,001 | $118,312 | $462,689 |
| 2020 | $3,222 | $435,000 | $95,700 | $339,300 |
| 2019 | $3,081 | $395,000 | $75,700 | $319,300 |
| 2018 | $3,142 | $388,000 | $75,700 | $312,300 |
| 2017 | $2,711 | $310,000 | $75,700 | $234,300 |
| 2016 | $2,578 | $162,829 | $44,209 | $118,620 |
| 2015 | $2,357 | $145,903 | $44,209 | $101,694 |
| 2014 | $2,158 | $129,573 | $44,209 | $85,364 |
Source: Public Records
Map
Nearby Homes
- 1616 W 3125 N Unit 7
- 1621 W 3125 N Unit 4
- 1629 W 3125 N Unit 5
- 4185 N Moose Dr Unit 126
- 4211 N Moose Dr Unit 128
- 4133 N Moose Dr Unit 125
- 1276 W Fallow Way
- 1199 W Fallow Way
- 1211 W Fallow Way
- 3414 N 1160 W Unit 214-R
- 1012 W 3550 N
- 1130 Fawn Dr
- 993 W 3800 N
- 3875 N 1000 W
- 4050 N 1100 W
- 1023 W 3350 N
- 0 W Pleasant View Dr
- 3862 N 900 W
- 2750 N Parkland Blvd E Unit 16
- 4277 N 1075 W
- 1534 W Pleasant View Dr
- 1508 W Pleasant View Dr
- 1508 W Pleasant View Dr Unit 7
- 3895 Price Ln
- 1570 W Pleasant View Dr
- 1506 W Pleasant View Dr
- 1576 W Pleasant View Dr
- 1545 W Pleasant View Dr
- 1509 W Pleasant View Dr
- 1480 W Pleasant View Dr
- 1588 W Pleasant View Dr
- 1470 W Pleasant View Dr
- 1539 W Pleasant View Dr
- 3785 N 1500 W
- 1460 W Pleasant View Dr
- 3781 N 1500 W
- 1608 W Pleasant View Dr
- 1396 W Pleasant View Dr
- 1453 W Pleasant View Dr
- 1438 W Pleasant View Dr