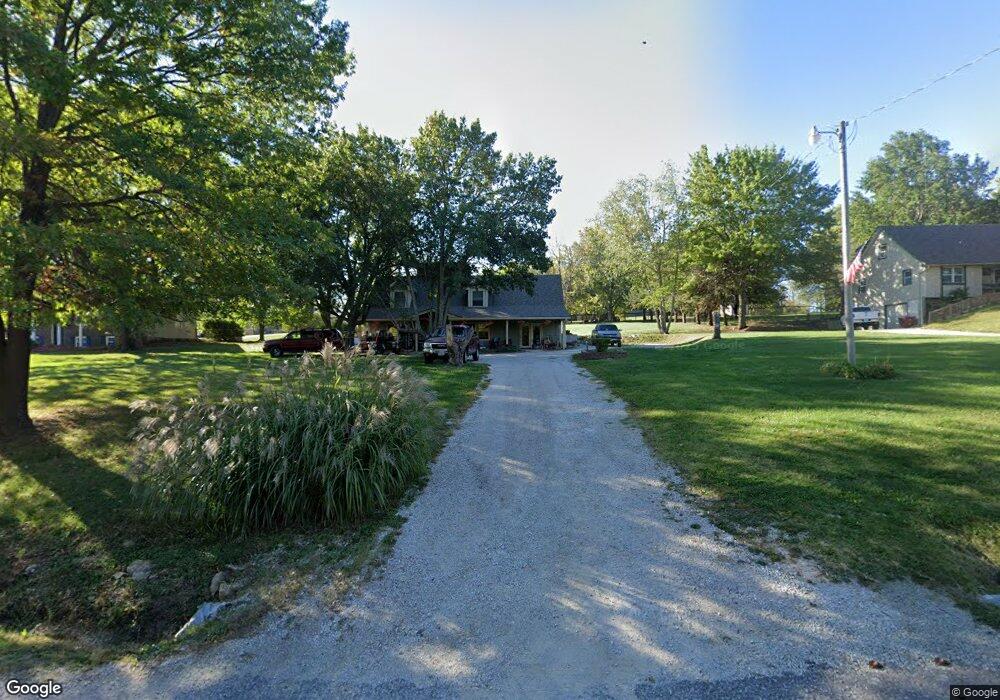
38809 E Boswell Rd Lone Jack, MO 64070
Estimated Value: $319,602 - $420,000
3
Beds
2
Baths
1,820
Sq Ft
$201/Sq Ft
Est. Value
About This Home
This home is located at 38809 E Boswell Rd, Lone Jack, MO 64070 and is currently estimated at $365,901, approximately $201 per square foot. 38809 E Boswell Rd is a home located in Jackson County with nearby schools including Lone Jack Elementary School and Lone Jack High School.
Ownership History
Date
Name
Owned For
Owner Type
Purchase Details
Closed on
Jan 14, 2025
Sold by
Wyse Carla J
Bought by
Wyse Alan L
Current Estimated Value
Home Financials for this Owner
Home Financials are based on the most recent Mortgage that was taken out on this home.
Original Mortgage
$210,000
Outstanding Balance
$208,630
Interest Rate
7.13%
Mortgage Type
New Conventional
Estimated Equity
$157,271
Purchase Details
Closed on
Aug 22, 2001
Sold by
Nauser Tamara L and Nauser James
Bought by
Wyse Alan L and Wyse Carla J
Home Financials for this Owner
Home Financials are based on the most recent Mortgage that was taken out on this home.
Original Mortgage
$107,590
Interest Rate
7.16%
Mortgage Type
FHA
Purchase Details
Closed on
Oct 11, 2000
Sold by
Nauser Tamara L and Ross Tamara L
Bought by
Nauser James L
Create a Home Valuation Report for This Property
The Home Valuation Report is an in-depth analysis detailing your home's value as well as a comparison with similar homes in the area
Purchase History
| Date | Buyer | Sale Price | Title Company |
|---|---|---|---|
| Wyse Alan L | -- | None Listed On Document | |
| Wyse Alan L | -- | Stewart Title | |
| Nauser James L | -- | -- |
Source: Public Records
Mortgage History
| Date | Status | Borrower | Loan Amount |
|---|---|---|---|
| Open | Wyse Alan L | $210,000 | |
| Previous Owner | Wyse Alan L | $107,590 |
Source: Public Records
Tax History
| Year | Tax Paid | Tax Assessment Tax Assessment Total Assessment is a certain percentage of the fair market value that is determined by local assessors to be the total taxable value of land and additions on the property. | Land | Improvement |
|---|---|---|---|---|
| 2025 | $3,308 | $40,956 | $13,108 | $27,848 |
| 2024 | $3,308 | $48,359 | $9,979 | $38,380 |
| 2023 | $3,230 | $48,359 | $9,103 | $39,256 |
| 2022 | $2,354 | $30,970 | $5,038 | $25,932 |
| 2021 | $2,290 | $30,970 | $5,038 | $25,932 |
| 2020 | $2,045 | $27,199 | $5,038 | $22,161 |
| 2019 | $2,037 | $27,199 | $5,038 | $22,161 |
| 2018 | $1,794 | $23,672 | $4,385 | $19,287 |
| 2017 | $1,758 | $23,672 | $4,385 | $19,287 |
| 2016 | $1,758 | $23,079 | $2,958 | $20,121 |
| 2014 | $1,782 | $23,079 | $2,958 | $20,121 |
Source: Public Records
Map
Nearby Homes
- 14913 S Outer Belt Extension
- 1960 NW 550th Rd
- 38305 E 155th St
- 36404 E County Line Rd
- 1933 NW 370th Rd
- 207 Black Jack Ave
- 12911 S Al Gossett Rd
- 511 NW 1891st Rd
- 532 NW Aa Hwy
- 403 NW Aa Hwy
- 12614 S Al Gossett Rd
- 15204 S Stewart Rd
- 205 E Woodland Ave
- 308 Oak St
- 15800 S State Route 7
- 34506 E Stewart Rd
- 34400 E Stewart Rd
- 117 E Maple St
- 110 Woodland Ave
- 106 E Woodland Ave
- 38901 E Boswell Rd
- 38803 E Boswell Rd
- 14517 S Outer Belt Extension
- 38909 E Boswell Rd
- 0 Outer Belt Extension
- 38913 E Boswell Rd
- 14523 S Outer Belt Rd
- 14419 S Outer Belt Extension
- 14516 S Outer Belt Extension
- 14603 S Outer Belt Rd
- 39004 E Boswell Rd
- 14600 S Outer Belt Extension
- 14600 S Outer Belt Extension
- 14609 S Outer Belt Extension
- 14609 S Outer Belt Extension
- 14405 S Outer Belt Extension
- 14410 S Outer Belt Extension
- 14610 S Outer Belt Rd
- 38603 E Boswell Rd
- 14621 Outer Belt Extension
Your Personal Tour Guide
Ask me questions while you tour the home.