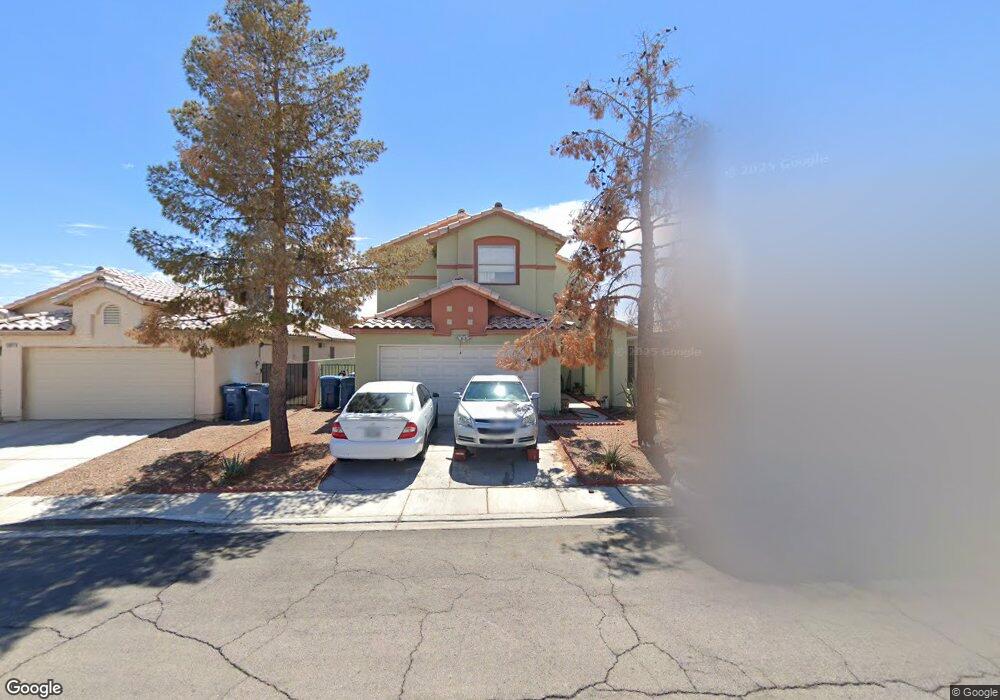
3881 Saint Mark Ct Las Vegas, NV 89104
Estimated Value: $328,668 - $367,000
3
Beds
3
Baths
1,407
Sq Ft
$244/Sq Ft
Est. Value
About This Home
This home is located at 3881 Saint Mark Ct, Las Vegas, NV 89104 and is currently estimated at $343,167, approximately $243 per square foot. 3881 Saint Mark Ct is a home located in Clark County with nearby schools including Walter V. Long Elementary School, Jerome Mack Middle School, and Chaparral High School.
Ownership History
Date
Name
Owned For
Owner Type
Purchase Details
Closed on
Apr 6, 2020
Sold by
Valle Maria
Bought by
Valle Maria and Maria Valle Rev Trust
Current Estimated Value
Purchase Details
Closed on
Oct 26, 2016
Sold by
Hus Investment Llc
Bought by
Valle Maria
Purchase Details
Closed on
Aug 9, 2016
Sold by
Natioanl Default Servicing
Bought by
Hus Investments Llc
Purchase Details
Closed on
Jul 16, 2003
Sold by
Vonganakasame Paul and Lim Paul
Bought by
Cabrera Ramon and Cabrera Gloria
Home Financials for this Owner
Home Financials are based on the most recent Mortgage that was taken out on this home.
Original Mortgage
$143,744
Interest Rate
6.17%
Mortgage Type
FHA
Purchase Details
Closed on
May 13, 1994
Sold by
Siefert Development Inc
Bought by
Vonganakasame Paul
Home Financials for this Owner
Home Financials are based on the most recent Mortgage that was taken out on this home.
Original Mortgage
$102,761
Interest Rate
8.1%
Mortgage Type
FHA
Create a Home Valuation Report for This Property
The Home Valuation Report is an in-depth analysis detailing your home's value as well as a comparison with similar homes in the area
Home Values in the Area
Average Home Value in this Area
Purchase History
| Date | Buyer | Sale Price | Title Company |
|---|---|---|---|
| Valle Maria | -- | None Available | |
| Valle Maria | $159,500 | National Title Co | |
| Hus Investments Llc | $123,100 | None Available | |
| Cabrera Ramon | $146,000 | Old Republic Title Company | |
| Vonganakasame Paul | $104,000 | United Title |
Source: Public Records
Mortgage History
| Date | Status | Borrower | Loan Amount |
|---|---|---|---|
| Previous Owner | Cabrera Ramon | $143,744 | |
| Previous Owner | Vonganakasame Paul | $102,761 |
Source: Public Records
Tax History Compared to Growth
Tax History
| Year | Tax Paid | Tax Assessment Tax Assessment Total Assessment is a certain percentage of the fair market value that is determined by local assessors to be the total taxable value of land and additions on the property. | Land | Improvement |
|---|---|---|---|---|
| 2025 | $1,037 | $67,694 | $22,750 | $44,944 |
| 2024 | $1,008 | $67,694 | $22,750 | $44,944 |
| 2023 | $1,008 | $68,535 | $25,550 | $42,985 |
| 2022 | $978 | $61,100 | $21,700 | $39,400 |
| 2021 | $950 | $57,587 | $19,950 | $37,637 |
| 2020 | $919 | $56,676 | $19,250 | $37,426 |
| 2019 | $893 | $53,488 | $16,450 | $37,038 |
| 2018 | $852 | $48,152 | $12,600 | $35,552 |
| 2017 | $1,363 | $46,489 | $10,500 | $35,989 |
| 2016 | $1,051 | $43,636 | $9,100 | $34,536 |
| 2015 | $1,048 | $35,053 | $7,000 | $28,053 |
| 2014 | $1,023 | $25,503 | $5,250 | $20,253 |
Source: Public Records
Map
Nearby Homes
- 1944 Randa Ln
- 4055 E New York Ave
- 2356 Grannis Ln
- 3887 Delling Ct
- 1601 S Sandhill Rd Unit 78
- 1601 S Sandhill Rd Unit 191
- 1892 Miner Way
- 4170 E Baltimore Ave
- 2278 Miner Way
- 4120 E Cincinnati Ave
- 2038 Palm St Unit 407
- 2038 Palm St Unit 60
- 2038 Palm St Unit 427
- 2038 Palm St Unit 321
- 2038 Palm St Unit 298
- 2038 Palm St Unit 47
- 2038 Palm St Unit 81
- 2038 Palm St Unit 169
- 2038 Palm St Unit 98
- 2038 Palm St Unit 275
- 3875 Saint Mark Ct
- 3887 Saint Mark Ct
- 3869 Saint Mark Ct
- 3880 Saint Luke Ct
- 3874 Saint Luke Ct
- 3886 Saint Luke Ct
- 3863 Saint Mark Ct
- 3868 Saint Luke Ct
- 3882 Saint Mark Ct
- 3876 Saint Mark Ct
- 3888 Saint Mark Ct
- 3862 Saint Luke Ct
- 1994 Shannon Christine Dr
- 1982 Shannon Christine Dr
- 3870 Saint Mark Ct
- 2006 Shannon Christine Dr
- 1970 Shannon Christine Dr
- 3864 Saint Mark Ct
- 2018 Shannon Christine Dr
- 1958 Shannon Christine Dr