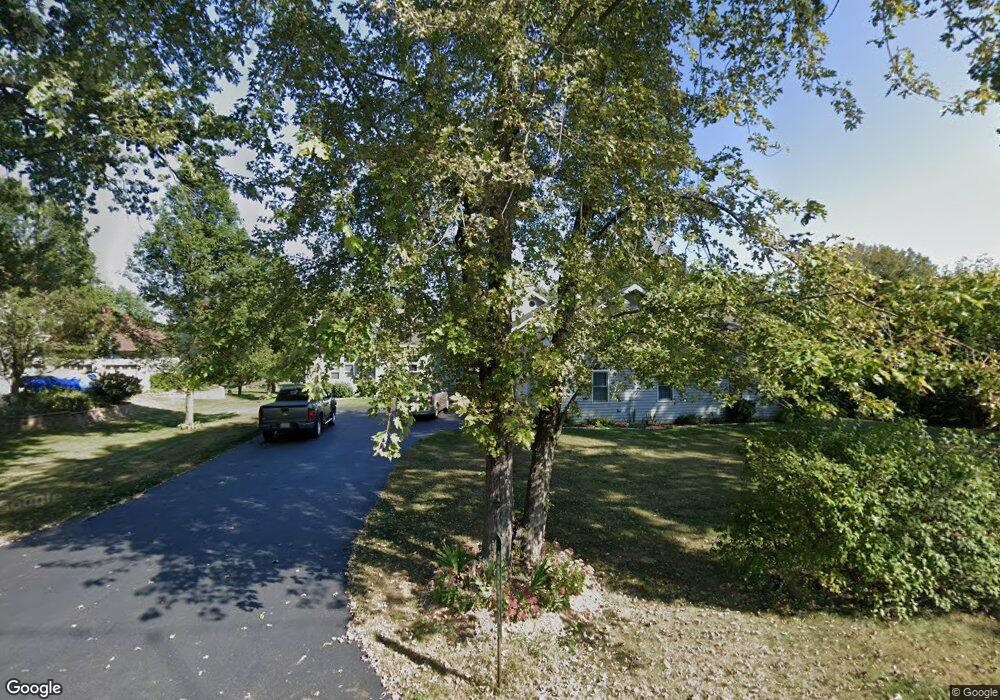
38813 N Drexel Blvd Antioch, IL 60002
Klondike NeighborhoodEstimated Value: $450,000 - $552,000
3
Beds
3
Baths
2,176
Sq Ft
$235/Sq Ft
Est. Value
About This Home
This home is located at 38813 N Drexel Blvd, Antioch, IL 60002 and is currently estimated at $510,629, approximately $234 per square foot. 38813 N Drexel Blvd is a home located in Lake County with nearby schools including Grass Lake Elementary School and Antioch Community High School.
Ownership History
Date
Name
Owned For
Owner Type
Purchase Details
Closed on
Sep 23, 2011
Sold by
Lee Dennis and Loe Therese
Bought by
Loe Dennis A and Loe Therese M
Current Estimated Value
Home Financials for this Owner
Home Financials are based on the most recent Mortgage that was taken out on this home.
Original Mortgage
$180,000
Outstanding Balance
$122,435
Interest Rate
4.12%
Mortgage Type
New Conventional
Estimated Equity
$388,194
Purchase Details
Closed on
Nov 3, 2010
Sold by
Loe Dennis A and Loe Therese M
Bought by
Loe Dennis and Loe Therese
Purchase Details
Closed on
Oct 5, 2010
Sold by
Loe Dennis A and Loe Therese M
Bought by
Loe Dennis and Loe Therese
Purchase Details
Closed on
Jun 5, 2006
Sold by
Loe Dennis A and Pederson Therese M
Bought by
Loe Dennis A and Loe Therese M
Purchase Details
Closed on
Nov 11, 2003
Sold by
Pederson Therese and Loe Dennis
Bought by
Pederson Therese and Loe Dennis
Purchase Details
Closed on
Jun 20, 2000
Sold by
Bicanic Mary and Mary Bicanic Trust
Bought by
Loe Dennis A and Pederson Therese M
Create a Home Valuation Report for This Property
The Home Valuation Report is an in-depth analysis detailing your home's value as well as a comparison with similar homes in the area
Home Values in the Area
Average Home Value in this Area
Purchase History
| Date | Buyer | Sale Price | Title Company |
|---|---|---|---|
| Loe Dennis A | -- | Blackhawk Title Services | |
| Loe Dennis | -- | None Available | |
| Loe Dennis | -- | None Available | |
| Loe Dennis A | -- | None Available | |
| Pederson Therese | -- | -- | |
| Loe Dennis A | $115,000 | -- |
Source: Public Records
Mortgage History
| Date | Status | Borrower | Loan Amount |
|---|---|---|---|
| Open | Loe Dennis A | $180,000 |
Source: Public Records
Tax History Compared to Growth
Tax History
| Year | Tax Paid | Tax Assessment Tax Assessment Total Assessment is a certain percentage of the fair market value that is determined by local assessors to be the total taxable value of land and additions on the property. | Land | Improvement |
|---|---|---|---|---|
| 2024 | $12,528 | $157,635 | $11,843 | $145,792 |
| 2023 | $10,093 | $151,516 | $10,604 | $140,912 |
| 2022 | $10,093 | $118,780 | $11,168 | $107,612 |
| 2021 | $9,351 | $110,833 | $10,421 | $100,412 |
| 2020 | $9,524 | $116,697 | $10,133 | $106,564 |
| 2019 | $10,129 | $111,597 | $9,690 | $101,907 |
| 2018 | $5,491 | $111,738 | $7,030 | $104,708 |
| 2017 | $10,531 | $106,356 | $6,691 | $99,665 |
| 2016 | $10,427 | $102,640 | $6,457 | $96,183 |
| 2015 | $10,509 | $100,029 | $6,293 | $93,736 |
| 2014 | $10,644 | $108,237 | $6,671 | $101,566 |
| 2012 | $10,259 | $108,237 | $6,671 | $101,566 |
Source: Public Records
Map
Nearby Homes
- 38830 N Drexel Blvd
- 38635 N Drexel Blvd
- 38815 N Broadway Ave
- 39203 Rangers Way
- 39225 Rangers Way
- 38871 N Lakeview Ave
- 39224 N Willow Ln
- 39247 Rangers Way
- 26633 W Astor St
- 26700 W Woodland Ave
- 38717 N Lake St
- 26307 W Grass Lake Rd
- 39563 N Channel View Dr Unit 2
- 38856 N Cedar Crest Dr
- 39490 N Summerside Dr
- 25164 W Sunset Ln
- 39477 N Hickory Ave
- 25455 W Greenview Ave
- 25073 W Megan Ct
- 25058 Megan Ct
- 38837 N Drexel Blvd
- 38785 N Drexel Blvd
- 38744 N Drexel Blvd
- 38776 N Broadway Ave
- 38855 N Drexel Blvd
- 26374 W Klondike Ave
- 38862 N Drexel Blvd
- 38727 N Drexel Blvd
- 26351 W Harlem Ave
- 26405 W Klondike Ave
- 26367 W Harlem Ave
- 38742 N Drexel Blvd
- 38716 N Drexel Blvd
- 26375 W Harlem Ave
- 26388 W Klondike Ave
- 38740 N Drexel Blvd
- 26404 W Klondike Ave
- 38886 N Drexel Blvd
- 38789 N Drexel Blvd
- 38902 N Drexel Blvd