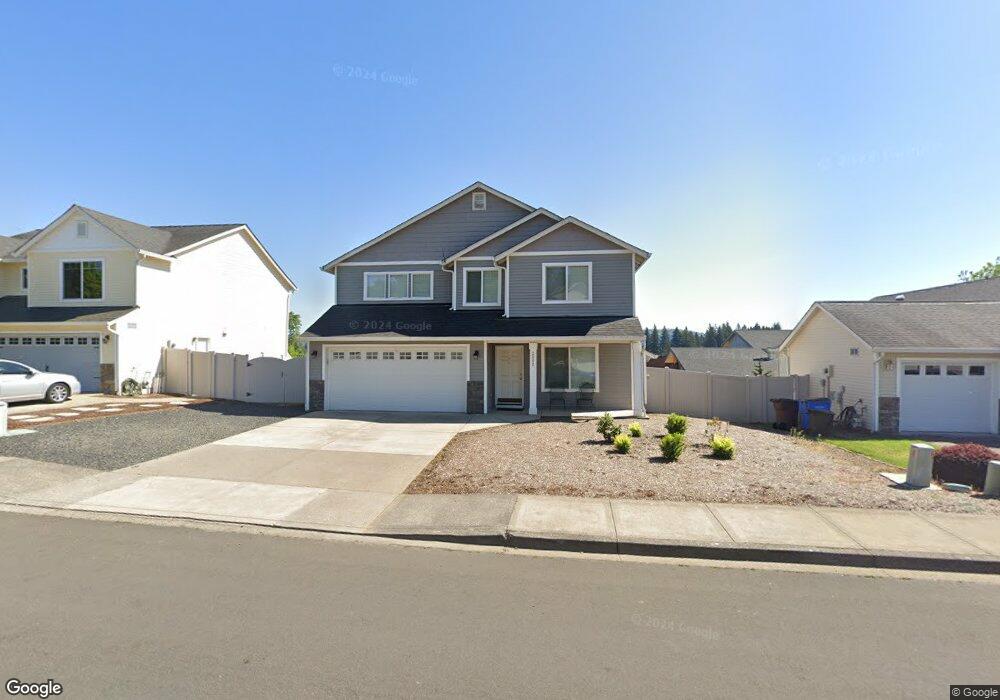
3882 P St Washougal, WA 98671
Estimated Value: $572,994 - $630,000
4
Beds
3
Baths
2,434
Sq Ft
$248/Sq Ft
Est. Value
About This Home
This home is located at 3882 P St, Washougal, WA 98671 and is currently estimated at $603,999, approximately $248 per square foot. 3882 P St is a home located in Clark County with nearby schools including Gause Elementary School, Jemtegaard Middle School, and Washougal High School.
Ownership History
Date
Name
Owned For
Owner Type
Purchase Details
Closed on
May 20, 2003
Sold by
Rockford Homes Inc
Bought by
Bevers Hal and Bevers Francisca
Current Estimated Value
Home Financials for this Owner
Home Financials are based on the most recent Mortgage that was taken out on this home.
Original Mortgage
$156,200
Outstanding Balance
$67,789
Interest Rate
5.77%
Mortgage Type
Purchase Money Mortgage
Estimated Equity
$536,210
Purchase Details
Closed on
Mar 11, 2003
Sold by
Lucin Larsen Llc
Bought by
Rockford Homes Inc
Purchase Details
Closed on
Feb 14, 2003
Sold by
Buffalo Ranch Llc
Bought by
Mattkev Llc
Create a Home Valuation Report for This Property
The Home Valuation Report is an in-depth analysis detailing your home's value as well as a comparison with similar homes in the area
Home Values in the Area
Average Home Value in this Area
Purchase History
| Date | Buyer | Sale Price | Title Company |
|---|---|---|---|
| Bevers Hal | $196,488 | First American Title | |
| Rockford Homes Inc | -- | Chicago Title Insurance | |
| Mattkev Llc | -- | Chicago Title Insurance |
Source: Public Records
Mortgage History
| Date | Status | Borrower | Loan Amount |
|---|---|---|---|
| Open | Bevers Hal | $156,200 | |
| Closed | Bevers Hal | $28,600 |
Source: Public Records
Tax History Compared to Growth
Tax History
| Year | Tax Paid | Tax Assessment Tax Assessment Total Assessment is a certain percentage of the fair market value that is determined by local assessors to be the total taxable value of land and additions on the property. | Land | Improvement |
|---|---|---|---|---|
| 2025 | $4,759 | $493,270 | $120,000 | $373,270 |
| 2024 | $4,559 | $501,600 | $144,000 | $357,600 |
| 2023 | $4,451 | $502,867 | $154,800 | $348,067 |
| 2022 | $4,411 | $480,830 | $154,800 | $326,030 |
| 2021 | $4,269 | $413,480 | $132,000 | $281,480 |
| 2020 | $4,075 | $375,507 | $120,000 | $255,507 |
| 2019 | $3,832 | $364,088 | $120,000 | $244,088 |
| 2018 | $3,847 | $362,014 | $0 | $0 |
| 2017 | $3,327 | $299,973 | $0 | $0 |
| 2016 | $3,239 | $284,904 | $0 | $0 |
| 2015 | $3,100 | $253,643 | $0 | $0 |
| 2014 | -- | $241,559 | $0 | $0 |
| 2013 | -- | $210,802 | $0 | $0 |
Source: Public Records
Map
Nearby Homes