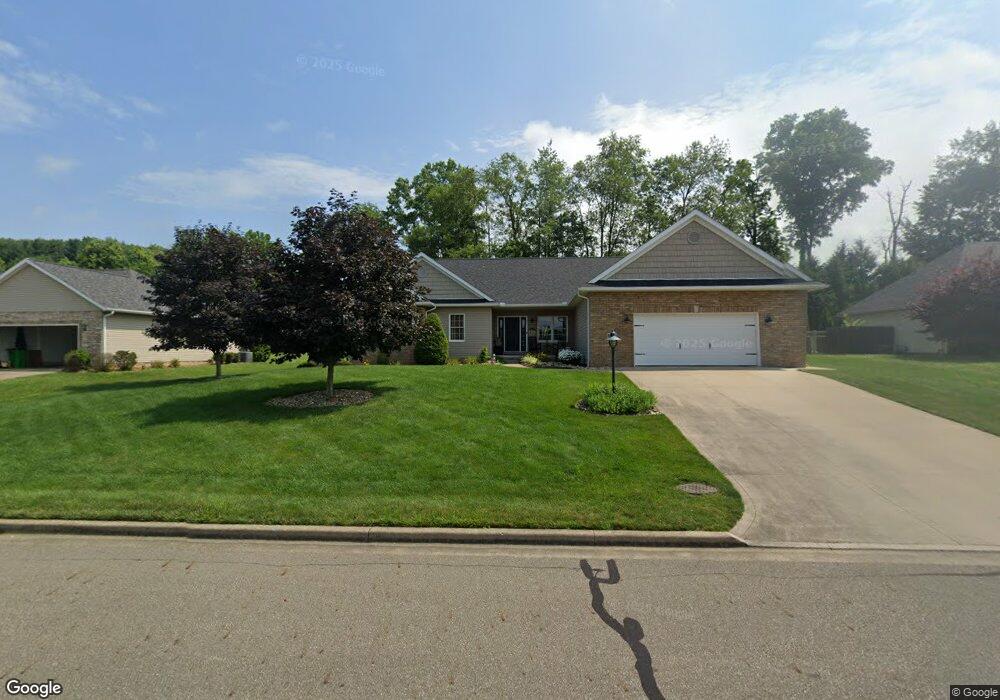
3883 Clay Ct SE Dennison, OH 44621
Estimated Value: $262,000 - $362,000
3
Beds
2
Baths
1,871
Sq Ft
$174/Sq Ft
Est. Value
About This Home
This home is located at 3883 Clay Ct SE, Dennison, OH 44621 and is currently estimated at $325,540, approximately $173 per square foot. 3883 Clay Ct SE is a home with nearby schools including Claymont High School and Immaculate Conception School.
Ownership History
Date
Name
Owned For
Owner Type
Purchase Details
Closed on
May 12, 2021
Sold by
Pittis Richard L and Pittis Ruth Ann
Bought by
Pittis Casey L and Pittis Keith R
Current Estimated Value
Purchase Details
Closed on
Sep 23, 2009
Sold by
Mast Builders Inc
Bought by
Pittis Richard L and Pittis Ruth Ann
Home Financials for this Owner
Home Financials are based on the most recent Mortgage that was taken out on this home.
Original Mortgage
$154,000
Interest Rate
5.38%
Mortgage Type
Purchase Money Mortgage
Purchase Details
Closed on
Dec 28, 2004
Sold by
Jenifer Ltd
Bought by
Mast Builders Inc
Create a Home Valuation Report for This Property
The Home Valuation Report is an in-depth analysis detailing your home's value as well as a comparison with similar homes in the area
Home Values in the Area
Average Home Value in this Area
Purchase History
| Date | Buyer | Sale Price | Title Company |
|---|---|---|---|
| Pittis Casey L | -- | None Available | |
| Pittis Richard L | $25,000 | Attorney | |
| Mast Builders Inc | $35,900 | Tusc Title |
Source: Public Records
Mortgage History
| Date | Status | Borrower | Loan Amount |
|---|---|---|---|
| Closed | Pittis Richard L | $154,000 |
Source: Public Records
Tax History Compared to Growth
Tax History
| Year | Tax Paid | Tax Assessment Tax Assessment Total Assessment is a certain percentage of the fair market value that is determined by local assessors to be the total taxable value of land and additions on the property. | Land | Improvement |
|---|---|---|---|---|
| 2024 | $2,657 | $81,840 | $10,820 | $71,020 |
| 2023 | $4,129 | $233,800 | $30,900 | $202,900 |
| 2022 | $2,737 | $81,830 | $10,815 | $71,015 |
| 2021 | $2,667 | $73,420 | $11,932 | $61,488 |
| 2020 | $2,727 | $73,420 | $11,932 | $61,488 |
| 2019 | $2,530 | $73,420 | $11,932 | $61,488 |
| 2018 | $2,335 | $65,440 | $10,640 | $54,800 |
| 2017 | $2,340 | $65,440 | $10,640 | $54,800 |
| 2016 | $2,324 | $65,440 | $10,640 | $54,800 |
| 2014 | $2,085 | $57,750 | $10,280 | $47,470 |
| 2013 | $2,090 | $57,750 | $10,280 | $47,470 |
Source: Public Records
Map
Nearby Homes
- 3264 Simpson Rd SE
- 2025 N Water Street Extension
- 4161 Indian Hill Rd SE
- 1508 Roanoke Ave
- 1870 Midvale Mine Rd SE
- 1221 Eastport Ave
- 0 Vernon St Unit 5009296
- 934 Parrish St
- 0 Royal St
- 2993 Brightwood Rd SE
- 834 N Water St
- 717 N 4th St
- 4711 Broadway
- 523 N 1st St
- 123 E 7th St
- 2923 Brightwood Rd SE
- 620 Gorley St
- 518 N Uhrich St
- 318 N 5th St
- 113 E 4th St