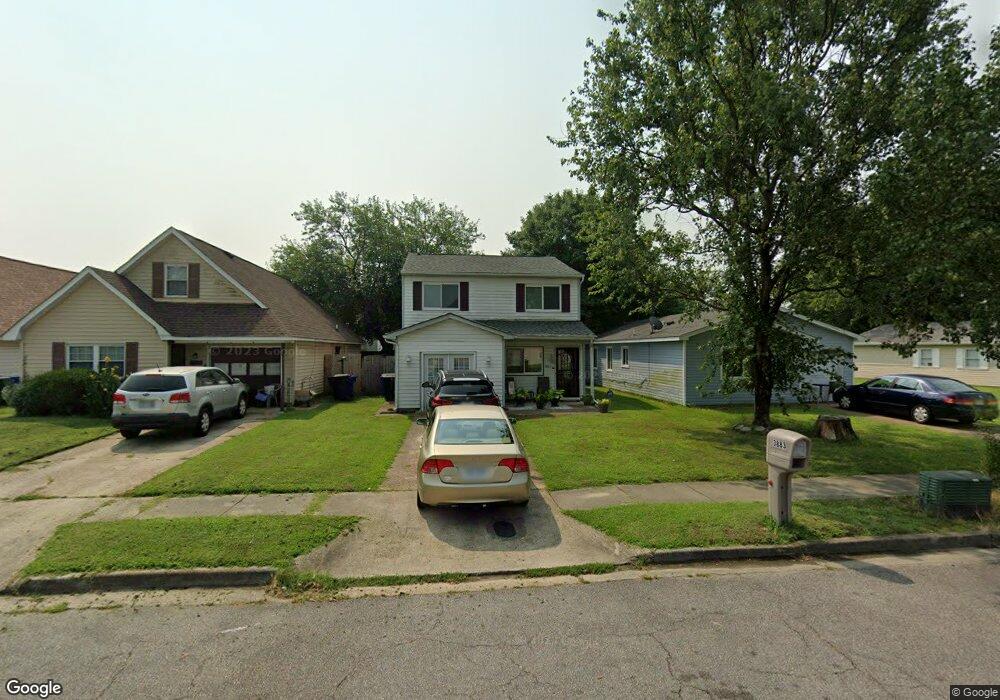
3883 Peachtree Ln W Portsmouth, VA 23703
Churchland NeighborhoodEstimated Value: $221,000 - $234,000
3
Beds
2
Baths
1,344
Sq Ft
$170/Sq Ft
Est. Value
About This Home
This home is located at 3883 Peachtree Ln W, Portsmouth, VA 23703 and is currently estimated at $228,824, approximately $170 per square foot. 3883 Peachtree Ln W is a home located in Portsmouth City with nearby schools including Churchland Primary/Intermediate School, Churchland Middle School, and Churchland High School.
Ownership History
Date
Name
Owned For
Owner Type
Purchase Details
Closed on
Sep 22, 2021
Sold by
Price Betty and Patterson Betty
Bought by
Price Betty
Current Estimated Value
Purchase Details
Closed on
Jan 5, 2010
Sold by
Federal Home Loan Mortgage Corporation
Bought by
Patterson Betty
Home Financials for this Owner
Home Financials are based on the most recent Mortgage that was taken out on this home.
Original Mortgage
$111,443
Outstanding Balance
$73,984
Interest Rate
5.25%
Mortgage Type
FHA
Estimated Equity
$154,840
Purchase Details
Closed on
Sep 18, 2009
Sold by
Professional Foreclosure Corp
Bought by
Federal Home Loan Mortgage Corporation
Purchase Details
Closed on
Jun 25, 2007
Sold by
Rusan Lahe I
Bought by
Garlick James H
Home Financials for this Owner
Home Financials are based on the most recent Mortgage that was taken out on this home.
Original Mortgage
$177,523
Interest Rate
6.24%
Mortgage Type
New Conventional
Create a Home Valuation Report for This Property
The Home Valuation Report is an in-depth analysis detailing your home's value as well as a comparison with similar homes in the area
Home Values in the Area
Average Home Value in this Area
Purchase History
| Date | Buyer | Sale Price | Title Company |
|---|---|---|---|
| Price Betty | -- | None Available | |
| Patterson Betty | $113,500 | -- | |
| Federal Home Loan Mortgage Corporation | $133,113 | -- | |
| Garlick James H | $174,900 | -- |
Source: Public Records
Mortgage History
| Date | Status | Borrower | Loan Amount |
|---|---|---|---|
| Open | Patterson Betty | $111,443 | |
| Previous Owner | Garlick James H | $177,523 |
Source: Public Records
Tax History Compared to Growth
Tax History
| Year | Tax Paid | Tax Assessment Tax Assessment Total Assessment is a certain percentage of the fair market value that is determined by local assessors to be the total taxable value of land and additions on the property. | Land | Improvement |
|---|---|---|---|---|
| 2025 | $2,522 | $195,430 | $44,530 | $150,900 |
| 2024 | $2,522 | $190,210 | $44,530 | $145,680 |
| 2023 | $2,127 | $170,120 | $44,530 | $125,590 |
| 2022 | $2,004 | $154,190 | $35,630 | $118,560 |
| 2021 | $1,823 | $140,210 | $29,690 | $110,520 |
| 2020 | $1,739 | $133,770 | $28,270 | $105,500 |
| 2019 | $1,674 | $128,740 | $28,270 | $100,470 |
| 2018 | $1,621 | $124,720 | $28,270 | $96,450 |
| 2017 | $1,595 | $122,710 | $28,270 | $94,440 |
| 2016 | $1,569 | $120,700 | $28,270 | $92,430 |
| 2015 | $1,543 | $118,690 | $28,270 | $90,420 |
| 2014 | $1,507 | $118,690 | $28,270 | $90,420 |
Source: Public Records
Map
Nearby Homes
- 3877 Peachtree Ln W
- 3818 Peach Orchard Cir
- 3866 Augustine Cir
- 3913 Stateflower Ct
- 3817 Harvest Ct
- 3860 Sugar Creek Cir
- 17 Shoal Ct
- 3660B Towne Point Rd Unit A
- 3791 Towne Point Rd
- 4100 Mayfair Way
- 4071 Long Point Blvd
- 8 Compass Ct
- 3715 Magnolia Dr
- 6446 Olde Bullocks Cir
- 3705 Bamboo Rd
- 6417 Pelican Crescent N
- 3433 Willow Breeze Dr
- 5807 Dunkin St
- 3836 Old Farm Rd
- 3616 Bowden St
- 3885 Peachtree Ln W
- 3881 Peachtree Ln W
- 3887 Peachtree Ln W
- 3824 Peach Orchard Cir
- 3822 Peach Orchard Cir
- 3826 Peach Orchard Cir
- 3889 Peachtree Ln W
- 3879 Peachtree Ln W
- 3828 Peach Orchard Cir
- 3820 Peach Orchard Cir
- 3830 Peach Orchard Cir
- 3891 Peachtree Ln W
- 3832 Peach Orchard Cir
- 3832 Peach Orchard Cir Unit CI
- 3875 Peachtree Ln W
- 3804 Georgia Ct
- 3802 Georgia Ct
- 3806 Georgia Ct
- 3816 Peach Orchard Cir
- 3800 Georgia Ct