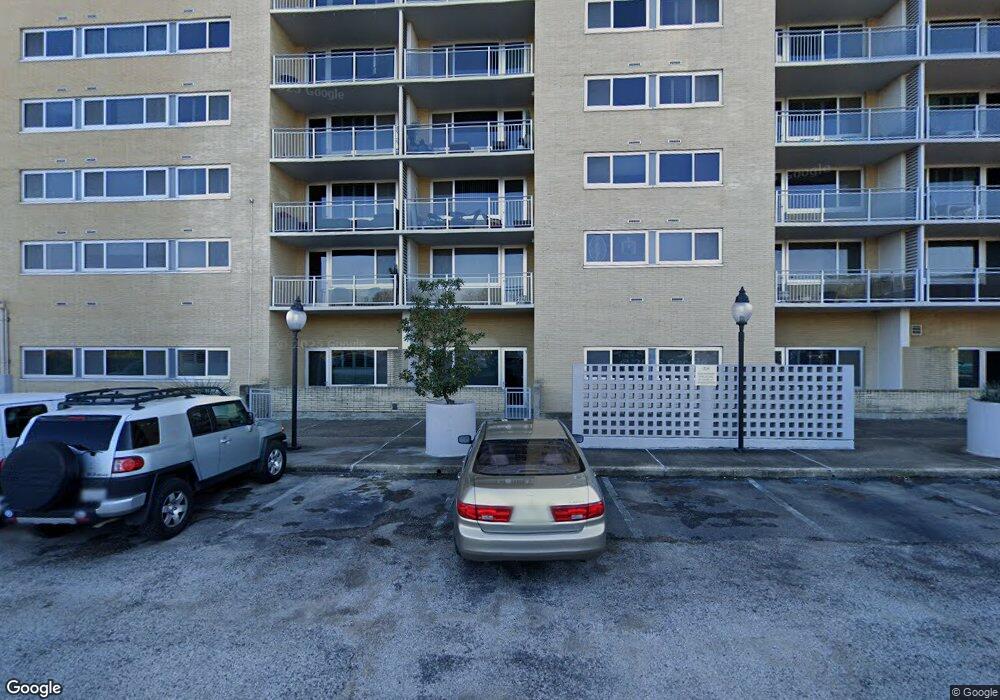
3883 Turtle Creek Blvd Unit 1510A Dallas, TX 75219
Turtle Creek NeighborhoodEstimated Value: $326,600 - $345,000
2
Beds
2
Baths
1,070
Sq Ft
$315/Sq Ft
Est. Value
About This Home
This home is located at 3883 Turtle Creek Blvd Unit 1510A, Dallas, TX 75219 and is currently estimated at $337,150, approximately $315 per square foot. 3883 Turtle Creek Blvd Unit 1510A is a home located in Dallas County with nearby schools including Ben Milam Elementary School, Alex W. Spence Talented/Gifted Academy, and North Dallas High School.
Ownership History
Date
Name
Owned For
Owner Type
Purchase Details
Closed on
Jul 2, 2008
Sold by
Lawrence Charles Murray and Lawrence Kimberly
Bought by
Sparks Kerrie R
Current Estimated Value
Home Financials for this Owner
Home Financials are based on the most recent Mortgage that was taken out on this home.
Original Mortgage
$105,000
Outstanding Balance
$67,876
Interest Rate
6.11%
Mortgage Type
Purchase Money Mortgage
Estimated Equity
$269,274
Purchase Details
Closed on
Jan 5, 2000
Sold by
Steiner June A
Bought by
Lawrence Charles M
Home Financials for this Owner
Home Financials are based on the most recent Mortgage that was taken out on this home.
Original Mortgage
$117,500
Interest Rate
7.86%
Mortgage Type
Seller Take Back
Purchase Details
Closed on
Jul 11, 1994
Sold by
Mcintosh A D Robert and Mcintosh Alison B
Bought by
Steiner June A
Create a Home Valuation Report for This Property
The Home Valuation Report is an in-depth analysis detailing your home's value as well as a comparison with similar homes in the area
Home Values in the Area
Average Home Value in this Area
Purchase History
| Date | Buyer | Sale Price | Title Company |
|---|---|---|---|
| Sparks Kerrie R | -- | None Available | |
| Lawrence Charles M | -- | -- | |
| Steiner June A | -- | -- |
Source: Public Records
Mortgage History
| Date | Status | Borrower | Loan Amount |
|---|---|---|---|
| Open | Sparks Kerrie R | $105,000 | |
| Previous Owner | Lawrence Charles M | $117,500 |
Source: Public Records
Tax History Compared to Growth
Tax History
| Year | Tax Paid | Tax Assessment Tax Assessment Total Assessment is a certain percentage of the fair market value that is determined by local assessors to be the total taxable value of land and additions on the property. | Land | Improvement |
|---|---|---|---|---|
| 2025 | $4,113 | $315,650 | $47,380 | $268,270 |
| 2024 | $4,113 | $315,650 | $53,840 | $261,810 |
| 2023 | $4,113 | $246,100 | $53,840 | $192,260 |
| 2022 | $6,153 | $246,100 | $53,840 | $192,260 |
| 2021 | $6,492 | $246,100 | $53,840 | $192,260 |
| 2020 | $6,676 | $246,100 | $53,840 | $192,260 |
| 2019 | $7,002 | $246,100 | $53,840 | $192,260 |
| 2018 | $5,092 | $187,250 | $53,840 | $133,410 |
| 2017 | $4,655 | $171,200 | $32,310 | $138,890 |
| 2016 | $4,364 | $160,500 | $21,540 | $138,960 |
| 2015 | $3,059 | $160,500 | $21,540 | $138,960 |
| 2014 | $3,059 | $140,000 | $21,540 | $118,460 |
Source: Public Records
Map
Nearby Homes
- 3883 Turtle Creek Blvd Unit 1007
- 3883 Turtle Creek Blvd Unit 1615
- 3883 Turtle Creek Blvd Unit 908
- 3883 Turtle Creek Blvd Unit 2015
- 3883 Turtle Creek Blvd Unit 2209
- 3883 Turtle Creek Blvd Unit 317
- 3883 Turtle Creek Blvd Unit 1205
- 3883 Turtle Creek Blvd Unit 204
- 3883 Turtle Creek Blvd Unit 1705-07
- 3883 Turtle Creek Blvd Unit 2011
- 3883 Turtle Creek Blvd Unit 1815a
- 3883 Turtle Creek Blvd Unit 2214
- 3883 Turtle Creek Blvd Unit 1417
- 3883 Turtle Creek Blvd Unit 511
- 3901 Turtle Creek Blvd Unit 14
- 3831 Turtle Creek Blvd Unit 23D
- 3831 Turtle Creek Blvd Unit 7E
- 4107 Rock Creek Dr
- 4030 Buena Vista St
- 4044 Buena Vista St Unit 104
- 3883 Turtle Creek Blvd Unit 2103A
- 3883 Turtle Creek Blvd Unit 1208A
- 3883 Turtle Creek Blvd Unit 208A
- 3883 Turtle Creek Blvd Unit 1914A
- 3883 Turtle Creek Blvd Unit 1916A
- 3883 Turtle Creek Blvd Unit 1205A
- 3883 Turtle Creek Blvd Unit 1212A
- 3883 Turtle Creek Blvd Unit 517A
- 3883 Turtle Creek Blvd Unit 311A
- 3883 Turtle Creek Blvd Unit 1909A
- 3883 Turtle Creek Blvd Unit 1812A
- 3883 Turtle Creek Blvd Unit 1401A
- 3883 Turtle Creek Blvd Unit 206A
- 3883 Turtle Creek Blvd Unit 717A
- 3883 Turtle Creek Blvd Unit 805A
- 3883 Turtle Creek Blvd Unit 2317P
- 3883 Turtle Creek Blvd Unit 1102A
- 3883 Turtle Creek Blvd Unit 511A
- 3883 Turtle Creek Blvd Unit 201A
- 3883 Turtle Creek Blvd Unit 509A