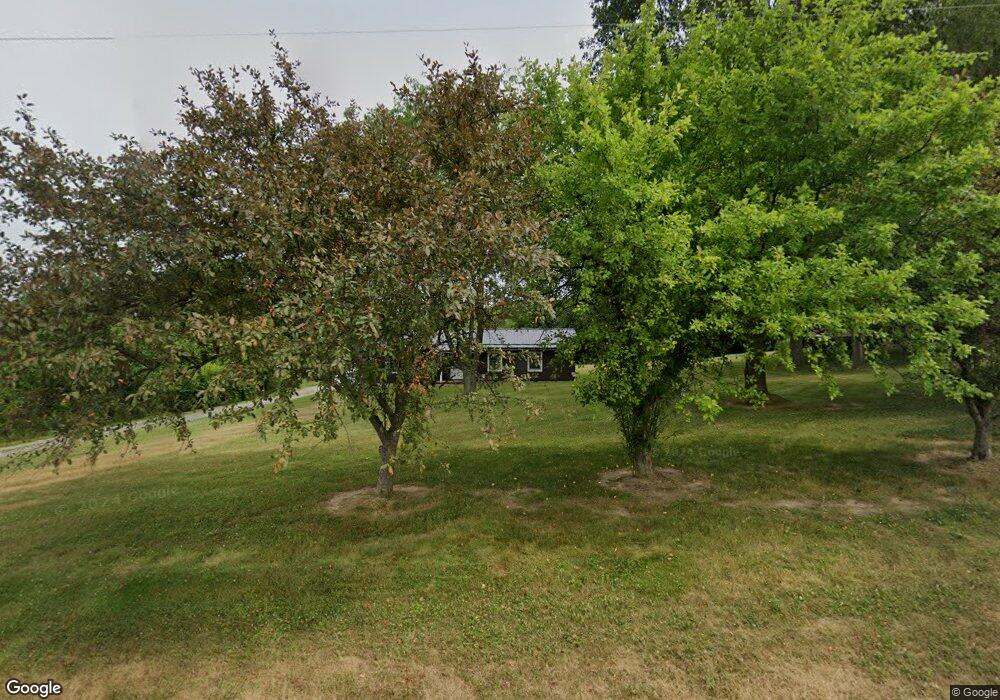
38838 Longs Crossing Rd Leetonia, OH 44431
Estimated Value: $107,000 - $253,000
3
Beds
1
Bath
1,352
Sq Ft
$133/Sq Ft
Est. Value
About This Home
This home is located at 38838 Longs Crossing Rd, Leetonia, OH 44431 and is currently estimated at $179,489, approximately $132 per square foot. 38838 Longs Crossing Rd is a home located in Columbiana County with nearby schools including Leetonia Elementary K-6, Leetonia Elementary School, and Leetonia Jr./Sr. High School.
Ownership History
Date
Name
Owned For
Owner Type
Purchase Details
Closed on
Nov 9, 2016
Sold by
Fannie Mae
Bought by
Jbek Investments Llc
Current Estimated Value
Purchase Details
Closed on
Sep 19, 2002
Sold by
Hud
Bought by
Davis George H and Davis Lisa K
Home Financials for this Owner
Home Financials are based on the most recent Mortgage that was taken out on this home.
Original Mortgage
$69,451
Interest Rate
6.32%
Mortgage Type
FHA
Purchase Details
Closed on
Feb 22, 2002
Sold by
Wright Wright William C William C and Wright James E
Bought by
Hud
Purchase Details
Closed on
Nov 23, 1999
Sold by
Ronshak Samuel T and Ronshak Laurie J
Bought by
Wright William C and Wright James E
Home Financials for this Owner
Home Financials are based on the most recent Mortgage that was taken out on this home.
Original Mortgage
$87,181
Interest Rate
7.88%
Mortgage Type
FHA
Purchase Details
Closed on
Jul 26, 1991
Bought by
Ronshak Samuel T and Ronshak Laurie
Create a Home Valuation Report for This Property
The Home Valuation Report is an in-depth analysis detailing your home's value as well as a comparison with similar homes in the area
Home Values in the Area
Average Home Value in this Area
Purchase History
| Date | Buyer | Sale Price | Title Company |
|---|---|---|---|
| Jbek Investments Llc | $58,000 | None Available | |
| Davis George H | $70,000 | Gateway Title Agency Inc | |
| Hud | $61,000 | -- | |
| Wright William C | $87,900 | Union Title Company | |
| Ronshak Samuel T | $28,900 | -- |
Source: Public Records
Mortgage History
| Date | Status | Borrower | Loan Amount |
|---|---|---|---|
| Previous Owner | Davis George H | $69,451 | |
| Previous Owner | Wright William C | $87,181 |
Source: Public Records
Tax History Compared to Growth
Tax History
| Year | Tax Paid | Tax Assessment Tax Assessment Total Assessment is a certain percentage of the fair market value that is determined by local assessors to be the total taxable value of land and additions on the property. | Land | Improvement |
|---|---|---|---|---|
| 2024 | $1,411 | $40,400 | $7,810 | $32,590 |
| 2023 | $1,413 | $40,400 | $7,810 | $32,590 |
| 2022 | $1,419 | $40,400 | $7,810 | $32,590 |
| 2021 | $1,205 | $32,870 | $7,040 | $25,830 |
| 2020 | $1,236 | $32,870 | $7,040 | $25,830 |
| 2019 | $1,248 | $32,870 | $7,040 | $25,830 |
| 2018 | $1,226 | $29,900 | $6,410 | $23,490 |
| 2017 | $1,241 | $29,900 | $6,410 | $23,490 |
| 2016 | $1,241 | $30,000 | $6,900 | $23,100 |
| 2015 | $1,261 | $30,000 | $6,900 | $23,100 |
| 2014 | $1,246 | $30,000 | $6,900 | $23,100 |
Source: Public Records
Map
Nearby Homes
- 3753 Grafton Rd
- 39144 State Route 558
- 3600 Leetonia Rd
- 38495 Old State Route 344
- 5415 Saint Jacobs Logtown Rd
- 38132 Eric Dr
- 6187 Lisbon Rd
- 38875 Old State Route 344
- 3892 Bunker Hill Rd
- 41793 Ohio 558
- 375 Pearl St
- 40320 State Route 517
- 41919 State Route 558
- 40330 Kelly Park Rd
- 7523 Ohio 164
- 457 Cherry Fork Ave
- 39528 Churchill Rd
- 405 Orchard Dr
- 406 Orchard Hill Dr
- 962 N Market St
- 38852 Longs Crossing Rd
- 38828 Longs Crossing Rd
- 38816 Longs Crossing Rd
- 4435 Grafton Rd
- 4435 Grafton Rd
- 4423 Grafton Rd
- 4411 Grafton Rd
- 4385 Grafton Rd
- 4446 Grafton Rd
- 4518 Grafton Rd
- 4337 Grafton Rd
- 38560 Longs Crossing Rd
- 39019 Longs Crossing Rd
- 38524 Longs Crossing Rd
- 4674 Grafton Rd
- 38486 Longs Crossing Rd
- 4190 Grafton Rd
- 38400 Longs Crossing Rd
- 4148 Grafton Rd
- 4912 Grafton Rd