
Seller's Agent in 2025
Megan Kline
Resident Realty North Metro LLC
(303) 842-3304
2 in this area
47 Total Sales

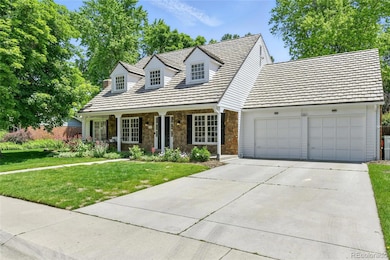


Welcome to this beautifully renovated, move-in ready home in the highly sought-after Southmoor Park neighborhood. Situated in a prime location close to parks, top-rated schools, Whole Foods, and popular local dining, this home offers a perfect blend of space, comfort, and convenience.
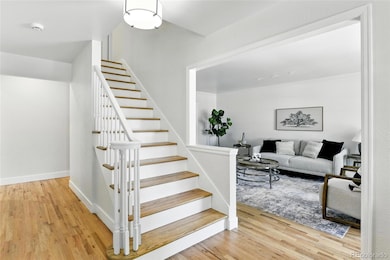
Upon entering, you'll be welcomed by sprawling refinished hardwood floors and a large, updated kitchen featuring quartz countertops, an eat-in island, generous pantry, and seamless flow into the sunroom—perfect for everyday living and entertaining.
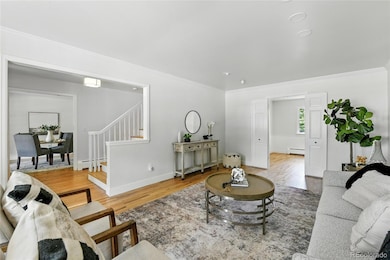
The main level offers a cozy family room with gas fireplace, office space, formal dining and living rooms, a powder bath, and convenient main-floor laundry. Enjoy direct access to the backyard from the family room, sunroom, and garage. A skylight and the sunroom bring in abundant natural light, creating a bright, inviting atmosphere.
Upstairs features four spacious bedrooms, including the primary suite with a private bathroom. Three additional bedrooms share a fully renovated full bath with stylish finishes.
The partially finished basement includes flex space for a gym, family room, or play area, plus a remodeled bath with luxurious steam shower. The unfinished space provides storage or potential for more finished square footage. A radon mitigation system is already installed.
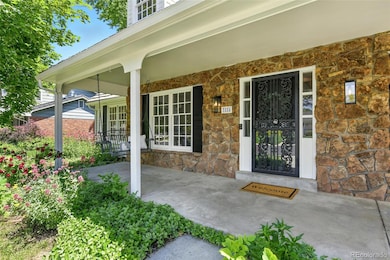
Step outside to large outdoor areas in the front and back. The yard is a true highlight—impressively sized, fully fenced, mature, and private, with space to gather, garden, or relax in the Colorado sunshine. The large backyard connects easily to indoor living spaces.
Other updates include new exterior paint, carpet, basement flooring, a cooling system, and refreshed landscaping. Located minutes from I-25, DTC, parks, trails, and just two blocks from Southmoor Elementary. Optional swim and tennis club membership adds even more to this exceptional lifestyle.
Last Agent to Sell the Property
Resident Realty North Metro LLC Brokerage Email: megckline@yahoo.com,303-842-3304 License #40033713 Listed on: 06/13/2025
| Date | Type | Sale Price | Title Company |
|---|---|---|---|
| Special Warranty Deed | $1,080,000 | Heritage Title | |
| Warranty Deed | $300,000 | First American Heritage Titl | |
| Interfamily Deed Transfer | -- | -- |
| Date | Status | Loan Amount | Loan Type |
|---|---|---|---|
| Open | $972,000 | New Conventional | |
| Previous Owner | $50,000 | Unknown | |
| Previous Owner | $403,901 | New Conventional | |
| Previous Owner | $417,000 | Unknown | |
| Previous Owner | $122,000 | Credit Line Revolving | |
| Previous Owner | $100,000 | Stand Alone Second | |
| Previous Owner | $465,000 | Unknown | |
| Previous Owner | $262,900 | Unknown | |
| Previous Owner | $262,900 | Unknown | |
| Previous Owner | $153,000 | Unknown | |
| Previous Owner | $47,500 | Credit Line Revolving | |
| Previous Owner | $48,500 | Stand Alone Second | |
| Previous Owner | $270,300 | Unknown | |
| Previous Owner | $225,000 | No Value Available | |
| Previous Owner | $200,000 | Unknown | |
| Closed | $45,000 | No Value Available |
| Date | Event | Price | Change | Sq Ft Price |
|---|---|---|---|---|
| 08/15/2025 08/15/25 | Sold | $1,080,000 | -2.6% | $334 / Sq Ft |
| 07/01/2025 07/01/25 | Price Changed | $1,109,000 | -3.5% | $343 / Sq Ft |
| 06/13/2025 06/13/25 | For Sale | $1,149,000 | -- | $356 / Sq Ft |
| Year | Tax Paid | Tax Assessment Tax Assessment Total Assessment is a certain percentage of the fair market value that is determined by local assessors to be the total taxable value of land and additions on the property. | Land | Improvement |
|---|---|---|---|---|
| 2024 | $4,287 | $54,130 | $10,650 | $43,480 |
| 2023 | $4,194 | $54,130 | $10,650 | $43,480 |
| 2022 | $3,550 | $44,640 | $14,870 | $29,770 |
| 2021 | $3,426 | $45,920 | $15,300 | $30,620 |
| 2020 | $3,199 | $43,120 | $13,010 | $30,110 |
| 2019 | $3,110 | $43,120 | $13,010 | $30,110 |
| 2018 | $2,829 | $36,570 | $11,560 | $25,010 |
| 2017 | $2,821 | $36,570 | $11,560 | $25,010 |
| 2016 | $2,996 | $36,740 | $4,259 | $32,481 |
| 2015 | $2,870 | $36,740 | $4,259 | $32,481 |
| 2014 | $2,739 | $32,980 | $11,940 | $21,040 |
Seller's Agent in 2025
Megan Kline
Resident Realty North Metro LLC
(303) 842-3304
2 in this area
47 Total Sales
J
Buyer's Agent in 2025
Jessica Maupin
LIV Sotheby's International Realty
(561) 715-5475
3 in this area
26 Total Sales
Source: REcolorado®
MLS Number: 4521057
APN: 7051-16-015
Disclaimer: Certain information contained herein is derived from information provided by parties other than Homes.com. All information provided is deemed reliable, but is not guaranteed to be accurate and should be independently verified.
![]() The content relating to real estate for sale in this Web site comes in part from the Internet Data eXchange (“IDX”) program of METROLIST, INC., DBA RECOLORADO®. Real estate listings held by brokers other than Ten-X are marked with the IDX Logo. This information is being provided for the consumers’ personal, non-commercial use and may not be used for any other purpose. All information subject to change and should be independently verified.
The content relating to real estate for sale in this Web site comes in part from the Internet Data eXchange (“IDX”) program of METROLIST, INC., DBA RECOLORADO®. Real estate listings held by brokers other than Ten-X are marked with the IDX Logo. This information is being provided for the consumers’ personal, non-commercial use and may not be used for any other purpose. All information subject to change and should be independently verified.
This publication is designed to provide information with regard to the subject matter covered. It is displayed with the understanding that the publisher and authors are not engaged in rendering real estate, legal, accounting, tax, or other professional services and that the publisher and authors are not offering such advice in this publication. If real estate, legal, or other expert assistance is required, the services of a competent, professional person should be sought.
The information contained in this publication is subject to change without notice. METROLIST, INC., DBA RECOLORADO MAKES NO WARRANTY OF ANY KIND WITH REGARD TO THIS MATERIAL, INCLUDING, BUT NOT LIMITED TO, THE IMPLIED WARRANTIES OF MERCHANTABILITY AND FITNESS FOR A PARTICULAR PURPOSE. METROLIST, INC., DBA RECOLORADO SHALL NOT BE LIABLE FOR ERRORS CONTAINED HEREIN OR FOR ANY DAMAGES IN CONNECTION WITH THE FURNISHING, PERFORMANCE, OR USE OF THIS MATERIAL.
PUBLISHER’S NOTICE: All real estate advertised herein is subject to the Federal Fair Housing Act and the Colorado Fair Housing Act, which Acts make it illegal to make or publish any advertisement that indicates any preference, limitation, or discrimination based on race, color, religion, sex, handicap, familial status, or national origin.
METROLIST, INC., DBA RECOLORADO will not knowingly accept any advertising for real estate that is in violation of the law. All persons are hereby informed that all dwellings advertised are available on an equal opportunity basis.
© 2025 METROLIST, INC., DBA RECOLORADO® – All Rights Reserved. 6455 S. Yosemite St., Suite 500 Greenwood Village, CO 80111 USA
ALL RIGHTS RESERVED WORLDWIDE. No part of this publication may be reproduced, adapted, translated, stored in a retrieval system or transmitted in any form or by any means, electronic, mechanical, photocopying, recording, or otherwise, without the prior written permission of the publisher. The information contained herein including but not limited to all text, photographs, digital images, virtual tours, may be seeded and monitored for protection and tracking.