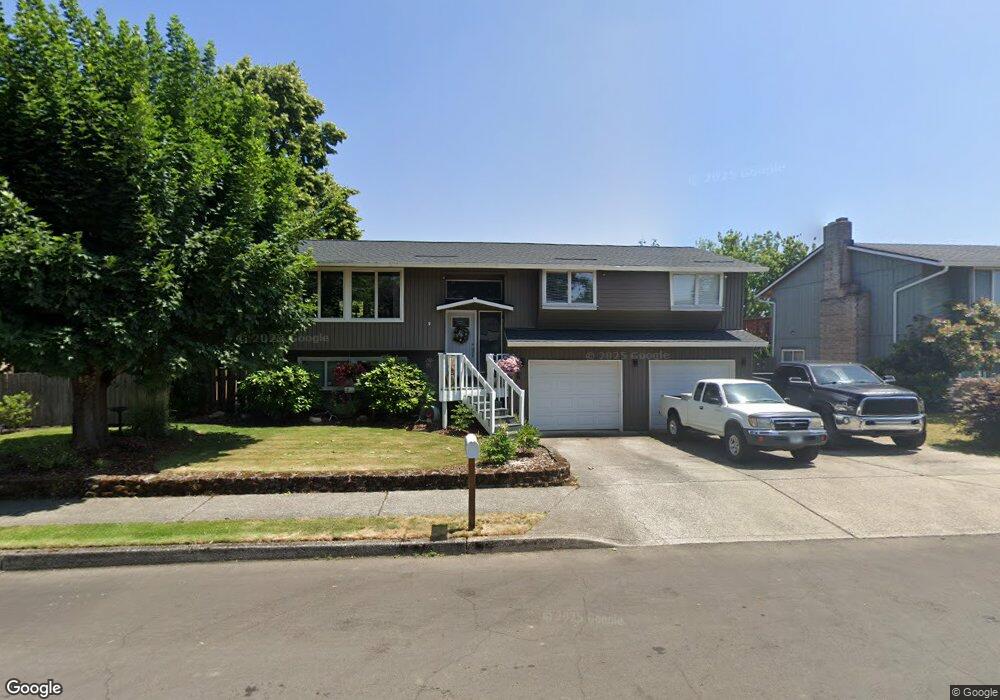
3886 NE Rene Ave Gresham, OR 97030
North Central NeighborhoodEstimated Value: $452,000 - $512,000
3
Beds
3
Baths
2,003
Sq Ft
$243/Sq Ft
Est. Value
About This Home
This home is located at 3886 NE Rene Ave, Gresham, OR 97030 and is currently estimated at $487,394, approximately $243 per square foot. 3886 NE Rene Ave is a home located in Multnomah County with nearby schools including Woodland Elementary School, Walt Morey Middle School, and Reynolds High School.
Ownership History
Date
Name
Owned For
Owner Type
Purchase Details
Closed on
Sep 9, 2004
Sold by
Wallachy Doug
Bought by
Bright Doug E
Current Estimated Value
Home Financials for this Owner
Home Financials are based on the most recent Mortgage that was taken out on this home.
Original Mortgage
$168,000
Outstanding Balance
$78,403
Interest Rate
5.12%
Mortgage Type
Purchase Money Mortgage
Estimated Equity
$408,991
Purchase Details
Closed on
Jan 30, 2004
Sold by
Jessup Janet G
Bought by
Wallachy Doug and Wallachy Debby
Purchase Details
Closed on
Jan 26, 1999
Sold by
Jessup Jon G
Bought by
Jessup Janet G
Purchase Details
Closed on
Jun 20, 1996
Sold by
Chin James K
Bought by
Jessup Jon G and Jessup Janet G
Home Financials for this Owner
Home Financials are based on the most recent Mortgage that was taken out on this home.
Original Mortgage
$128,250
Interest Rate
8.25%
Mortgage Type
Purchase Money Mortgage
Create a Home Valuation Report for This Property
The Home Valuation Report is an in-depth analysis detailing your home's value as well as a comparison with similar homes in the area
Home Values in the Area
Average Home Value in this Area
Purchase History
| Date | Buyer | Sale Price | Title Company |
|---|---|---|---|
| Bright Doug E | $210,000 | Ticor Title Insurance Compan | |
| Wallachy Doug | $155,000 | First American Title Ins Co | |
| Jessup Janet G | -- | -- | |
| Jessup Jon G | $135,000 | Fidelity National Title Co |
Source: Public Records
Mortgage History
| Date | Status | Borrower | Loan Amount |
|---|---|---|---|
| Open | Bright Doug E | $168,000 | |
| Previous Owner | Jessup Jon G | $128,250 | |
| Closed | Bright Doug E | $42,000 |
Source: Public Records
Tax History
| Year | Tax Paid | Tax Assessment Tax Assessment Total Assessment is a certain percentage of the fair market value that is determined by local assessors to be the total taxable value of land and additions on the property. | Land | Improvement |
|---|---|---|---|---|
| 2025 | $5,267 | $274,460 | -- | -- |
| 2024 | $4,983 | $266,470 | -- | -- |
| 2023 | $4,983 | $258,710 | -- | -- |
| 2022 | $4,398 | $251,180 | $0 | $0 |
| 2021 | $4,289 | $243,870 | $0 | $0 |
| 2020 | $4,013 | $236,770 | $0 | $0 |
| 2019 | $3,847 | $229,880 | $0 | $0 |
| 2018 | $3,808 | $223,190 | $0 | $0 |
| 2017 | $3,685 | $216,690 | $0 | $0 |
| 2016 | $3,525 | $210,380 | $0 | $0 |
| 2015 | $3,423 | $204,260 | $0 | $0 |
| 2014 | $3,307 | $198,320 | $0 | $0 |
Source: Public Records
Map
Nearby Homes
- 2516 SW 23rd St
- 2220 SW Brink Ave
- 3311 NE View Ave Unit 3313
- 2701 SW Latourell Place
- 24141 SE Oak St
- 2103 SW Stella Way
- 1431 SW 22nd St Unit 1433
- 1548 SW Northstar Loop
- 2797 NE Rene Ave Unit 25C
- 24066 NE Treehill Dr Unit 12
- 2846 SW Faith Ct
- 2921 NE Rene Ave Unit 15B
- 24046 NE Treehill Dr Unit 7
- 24044 NE Treehill Dr Unit 6
- 1021 SW 24th St
- 1556 NE 27th Terrace
- 23882 NE Treehill Dr Unit T3882
- 23932 NE Poplar Ct
- 3214 NE 29th St Unit 48
- 1603 SW Hewitt Ave
- 3874 NE Rene Ave
- 2310 SW 23rd St
- 2244 SW 23rd St
- 2247 NE 38th Dr
- 3830 NE Rene Ave
- 2232 SW 23rd St
- 3879 NE Rene Ave
- 2235 NE 38th Dr
- 2328 SW 23rd St
- 3863 NE Rene Ave
- 2261 NE 38th Dr
- 3845 NE Rene Ave
- 2228 SW 23rd St
- 2305 SW 23rd St
- 2336 SW 23rd St
- 2313 SW 23rd St
- 2237 SW 23rd St
- 2321 SW 23rd St
- 3866 NE Francis Place
- 3850 NE Francis Place
Your Personal Tour Guide
Ask me questions while you tour the home.