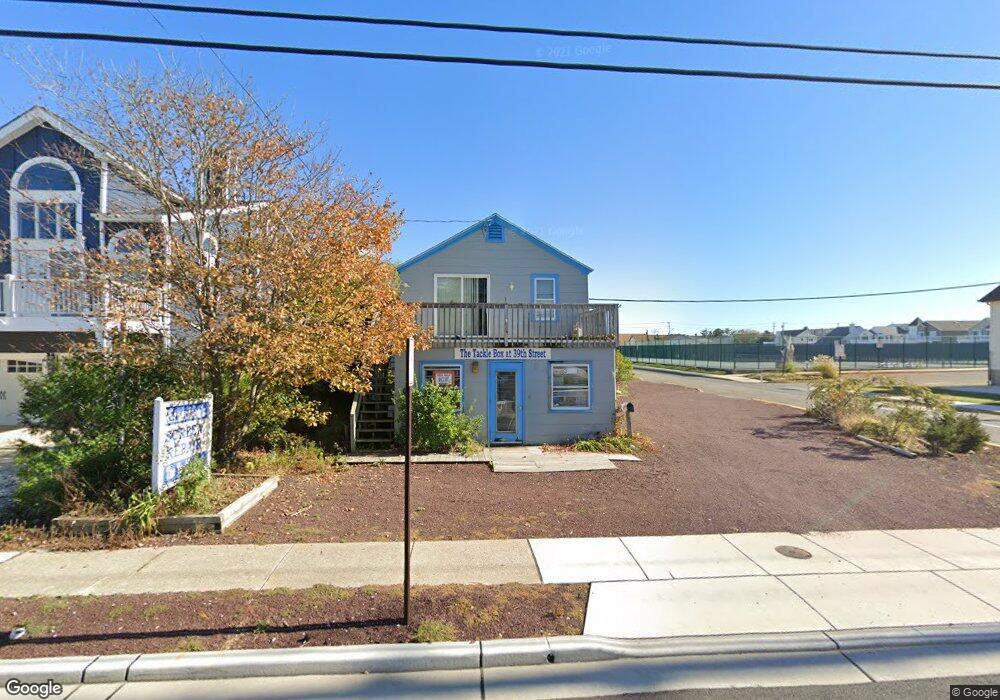
3889 Ocean Dr Avalon, NJ 08202
Estimated Value: $3,445,000
Studio
--
Bath
1,936
Sq Ft
$1,779/Sq Ft
Est. Value
About This Home
This home is located at 3889 Ocean Dr, Avalon, NJ 08202 and is currently estimated at $3,445,000, approximately $1,779 per square foot. 3889 Ocean Dr is a home with nearby schools including Avalon Elementary School.
Ownership History
Date
Name
Owned For
Owner Type
Purchase Details
Closed on
Sep 18, 2024
Sold by
Richardson Wilda W and Richardson Donald W
Bought by
Richardson Donald W
Current Estimated Value
Purchase Details
Closed on
Jul 8, 2020
Sold by
Richardson Donald W and Richardson John L
Bought by
Richardson John J and Richardson Wilda W
Purchase Details
Closed on
Sep 3, 2019
Sold by
Richardson John J and Richardson Wilda W
Bought by
Richardson Don
Purchase Details
Closed on
Dec 19, 2011
Sold by
Richardson John J and Richardson Wilda W
Bought by
Richardson John J and Richardson Wilda W
Purchase Details
Closed on
Jul 5, 1994
Sold by
Woodsadole Inc
Bought by
Zbieranowski Richard M and Zbieranowski Melissa
Purchase Details
Closed on
Aug 26, 1991
Sold by
Batts Agnes M
Bought by
Richardson John H and Richardson Wilda W
Create a Home Valuation Report for This Property
The Home Valuation Report is an in-depth analysis detailing your home's value as well as a comparison with similar homes in the area
Home Values in the Area
Average Home Value in this Area
Purchase History
| Date | Buyer | Sale Price | Title Company |
|---|---|---|---|
| Richardson Donald W | -- | None Listed On Document | |
| Richardson John J | -- | None Available | |
| Richardson Don | -- | -- | |
| Richardson John J | -- | None Available | |
| Zbieranowski Richard M | $26,500 | -- | |
| Richardson John H | $110,000 | -- |
Source: Public Records
Tax History
| Year | Tax Paid | Tax Assessment Tax Assessment Total Assessment is a certain percentage of the fair market value that is determined by local assessors to be the total taxable value of land and additions on the property. | Land | Improvement |
|---|---|---|---|---|
| 2025 | $4,936 | $803,900 | $735,000 | $68,900 |
| 2024 | $4,936 | $803,900 | $735,000 | $68,900 |
Source: Public Records
Map
Nearby Homes
- 264 41st St
- 4040 Dune Dr
- 198 40th St
- 256 42nd St
- 253 35th St Unit WEST
- 3429 Dune Dr
- 162 33rd St
- 173 33rd St Unit 3
- 179 32nd St
- 4640 Ocean Dr
- 4610 4th Ave
- 3149 First Ave
- 55 32nd St W Unit C2B
- 55 32nd St W
- 55 32nd St W Unit 1A
- 2934 Ocean Dr Unit North
- 25 32nd St W
- 2928 Ocean Dr Unit C-N
- 2988 1st Ave
- 2968 First Ave
Your Personal Tour Guide
Ask me questions while you tour the home.