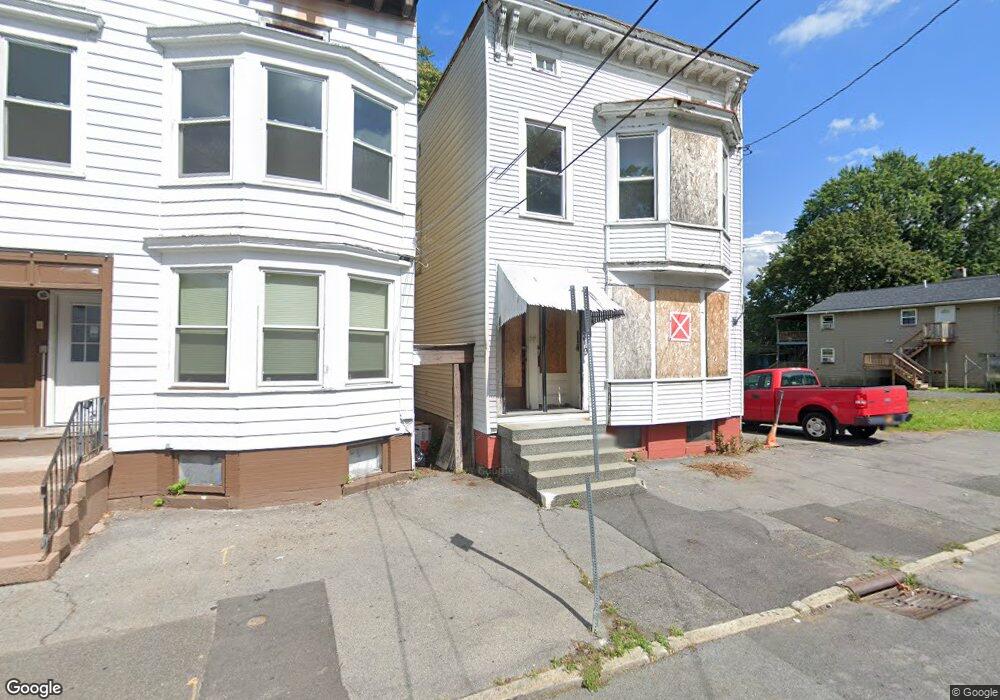
389 2nd St Albany, NY 12206
West Hill NeighborhoodEstimated Value: $122,000 - $195,961
6
Beds
2
Baths
2,186
Sq Ft
$77/Sq Ft
Est. Value
About This Home
This home is located at 389 2nd St, Albany, NY 12206 and is currently estimated at $168,990, approximately $77 per square foot. 389 2nd St is a home located in Albany County with nearby schools including Sheridan Preparatory Academy, Stephen And Harriet Myers Middle School, and Albany High School.
Ownership History
Date
Name
Owned For
Owner Type
Purchase Details
Closed on
Jul 24, 2018
Sold by
Albany County Land Bank Corporation
Bought by
Mcgovern Enterprises Llc
Current Estimated Value
Purchase Details
Closed on
Jan 12, 2016
Sold by
Enforcing Officer Of The Coutny Fo Alban and Thelen Shawn A
Bought by
County Of Albany New York
Purchase Details
Closed on
Jul 12, 2013
Sold by
Mekkatte Joy
Bought by
Clark Clyde Claude
Purchase Details
Closed on
Oct 4, 2007
Sold by
Littlejohn Barry
Bought by
Mekkatte Joy
Purchase Details
Closed on
Jun 9, 2005
Sold by
Lewis Pauline
Bought by
Littlejohn Barry
Create a Home Valuation Report for This Property
The Home Valuation Report is an in-depth analysis detailing your home's value as well as a comparison with similar homes in the area
Home Values in the Area
Average Home Value in this Area
Purchase History
| Date | Buyer | Sale Price | Title Company |
|---|---|---|---|
| Mcgovern Enterprises Llc | $5,500 | None Available | |
| County Of Albany New York | -- | None Available | |
| Clark Clyde Claude | -- | None Available | |
| Mekkatte Joy | $27,500 | William Tessitore | |
| Littlejohn Barry | $61,000 | Steven D Farer |
Source: Public Records
Tax History Compared to Growth
Tax History
| Year | Tax Paid | Tax Assessment Tax Assessment Total Assessment is a certain percentage of the fair market value that is determined by local assessors to be the total taxable value of land and additions on the property. | Land | Improvement |
|---|---|---|---|---|
| 2024 | $3,293 | $122,000 | $24,400 | $97,600 |
| 2023 | $591 | $15,000 | $4,600 | $10,400 |
| 2022 | $578 | $15,000 | $4,600 | $10,400 |
| 2021 | $577 | $15,000 | $4,600 | $10,400 |
| 2020 | $569 | $15,000 | $4,600 | $10,400 |
| 2019 | $1,517 | $15,000 | $4,600 | $10,400 |
| 2018 | $1,517 | $15,000 | $4,600 | $10,400 |
| 2017 | $1,517 | $15,000 | $4,600 | $10,400 |
| 2016 | $1,357 | $15,000 | $4,600 | $10,400 |
| 2015 | $3,562 | $65,000 | $18,400 | $46,600 |
| 2014 | -- | $65,000 | $18,400 | $46,600 |
Source: Public Records
Map
Nearby Homes