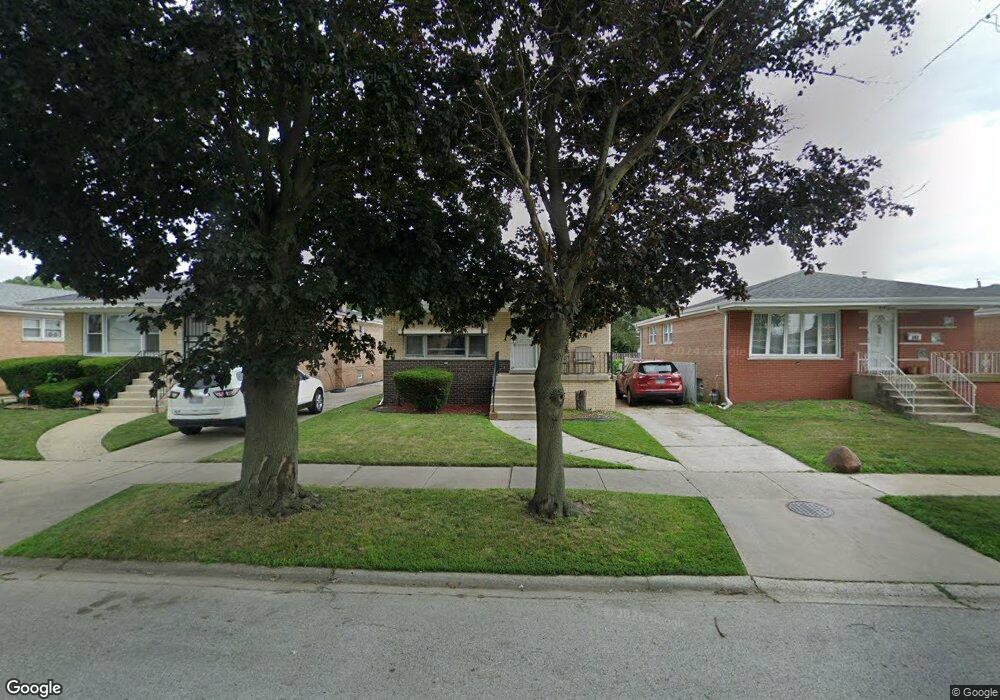
389 Calhoun Ave Calumet City, IL 60409
Estimated Value: $196,459 - $261,000
3
Beds
2
Baths
1,260
Sq Ft
$177/Sq Ft
Est. Value
About This Home
This home is located at 389 Calhoun Ave, Calumet City, IL 60409 and is currently estimated at $223,365, approximately $177 per square foot. 389 Calhoun Ave is a home located in Cook County with nearby schools including Caroline Sibley Elementary School, School Of Fine Arts Academy, and Creative Communications Academy.
Ownership History
Date
Name
Owned For
Owner Type
Purchase Details
Closed on
Aug 30, 2016
Sold by
Reed Hazel and Lambert Deborah
Bought by
Lambert Deborah
Current Estimated Value
Purchase Details
Closed on
Oct 21, 2008
Sold by
Hawkins Bertha L and Clay Linda E
Bought by
Lambert Deborah and Reed Hazel
Home Financials for this Owner
Home Financials are based on the most recent Mortgage that was taken out on this home.
Original Mortgage
$109,900
Outstanding Balance
$70,580
Interest Rate
5.73%
Mortgage Type
Unknown
Estimated Equity
$152,785
Purchase Details
Closed on
Sep 26, 2006
Sold by
Hawkins Bertha L
Bought by
Hawkins Bertha L and Clay Linda E
Purchase Details
Closed on
Jun 30, 2006
Sold by
Hawkins Bertha L and Clay Linda E
Bought by
Hawkins Bertha L
Home Financials for this Owner
Home Financials are based on the most recent Mortgage that was taken out on this home.
Original Mortgage
$55,000
Interest Rate
6.73%
Mortgage Type
New Conventional
Create a Home Valuation Report for This Property
The Home Valuation Report is an in-depth analysis detailing your home's value as well as a comparison with similar homes in the area
Home Values in the Area
Average Home Value in this Area
Purchase History
| Date | Buyer | Sale Price | Title Company |
|---|---|---|---|
| Lambert Deborah | -- | Alliance Title Corporation | |
| Lambert Deborah | $157,000 | Alliance Title Corporation | |
| Hawkins Bertha L | -- | None Available | |
| Hawkins Bertha L | -- | Stewart Title Of Illinois |
Source: Public Records
Mortgage History
| Date | Status | Borrower | Loan Amount |
|---|---|---|---|
| Open | Lambert Deborah | $109,900 | |
| Previous Owner | Hawkins Bertha L | $55,000 |
Source: Public Records
Tax History Compared to Growth
Tax History
| Year | Tax Paid | Tax Assessment Tax Assessment Total Assessment is a certain percentage of the fair market value that is determined by local assessors to be the total taxable value of land and additions on the property. | Land | Improvement |
|---|---|---|---|---|
| 2024 | $6,883 | $15,000 | $2,772 | $12,228 |
| 2023 | $5,269 | $15,000 | $2,772 | $12,228 |
| 2022 | $5,269 | $10,760 | $2,394 | $8,366 |
| 2021 | $5,043 | $10,760 | $2,394 | $8,366 |
| 2020 | $4,783 | $10,760 | $2,394 | $8,366 |
| 2019 | $4,430 | $9,431 | $2,016 | $7,415 |
| 2018 | $4,407 | $9,431 | $2,016 | $7,415 |
| 2017 | $4,267 | $9,431 | $2,016 | $7,415 |
| 2016 | $4,465 | $9,190 | $1,890 | $7,300 |
| 2015 | $4,279 | $9,190 | $1,890 | $7,300 |
| 2014 | $3,036 | $9,190 | $1,890 | $7,300 |
| 2013 | $4,851 | $10,797 | $1,890 | $8,907 |
Source: Public Records
Map
Nearby Homes
- 383 Calhoun Ave
- 372 Bensley Ave
- 412 Saginaw Ave
- 381 Yates Ave
- 453 Hoxie Ave
- 353 Yates Ave
- 349 Yates Ave
- 341 Saginaw Ave
- 430 Marquette Ave
- 286 Calhoun Ave
- 452 Yates Ave
- 281 Hoxie Ave
- 327 Marquette Ave
- 289 Saginaw Ave
- 508 Hoxie Ave
- 530 Bensley Ave
- 14541 S Marquette Ave
- 1613 Astor St Unit 1W
- 1613 Astor St Unit 16131E
- 1155 Harding Ave
- 393 Calhoun Ave
- 387 Calhoun Ave
- 395 Calhoun Ave
- 379 Calhoun Ave
- 399 Calhoun Ave
- 390 Hoxie Ave
- 388 Hoxie Ave
- 394 Hoxie Ave
- 405 Calhoun Ave
- 384 Hoxie Ave
- 396 Hoxie Ave
- 390 Calhoun Ave
- 400 Hoxie Ave
- 394 Calhoun Ave
- 388 Calhoun Ave
- 371 Calhoun Ave
- 407 Calhoun Ave
- 396 Calhoun Ave
- 384 Calhoun Ave
- 376 Hoxie Ave