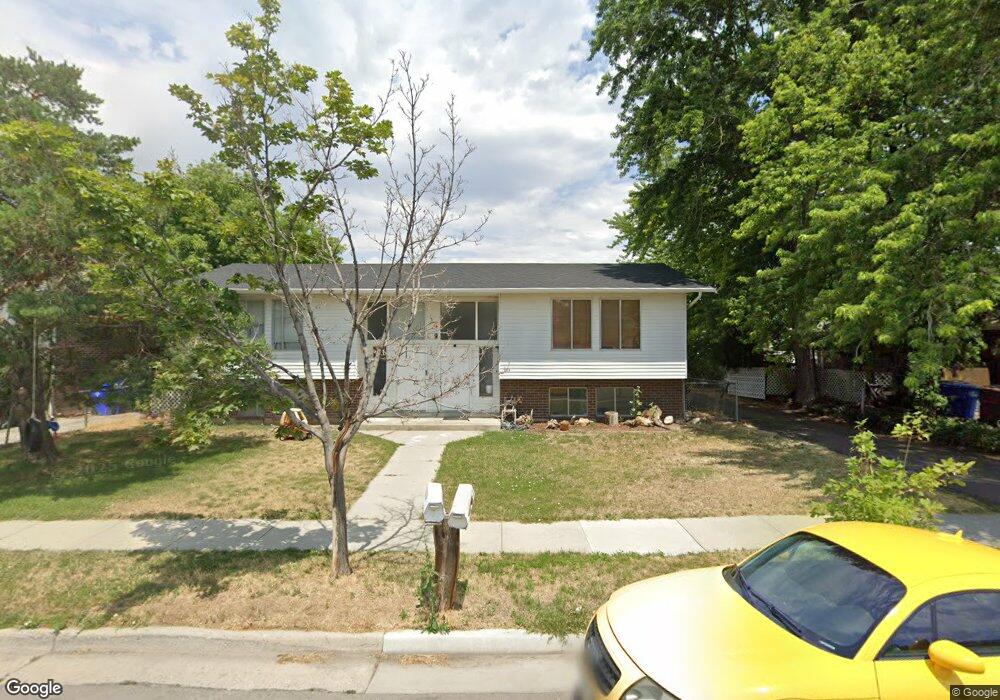
389 E 7670 S Midvale, UT 84047
Estimated Value: $554,541 - $669,000
4
Beds
4
Baths
2,372
Sq Ft
$262/Sq Ft
Est. Value
About This Home
This home is located at 389 E 7670 S, Midvale, UT 84047 and is currently estimated at $621,885, approximately $262 per square foot. 389 E 7670 S is a home located in Salt Lake County with nearby schools including Midvalley Elementary School, Union Middle School, and Hillcrest High School.
Ownership History
Date
Name
Owned For
Owner Type
Purchase Details
Closed on
Jul 9, 2021
Sold by
Morris Tanner J and Morris Rachel M
Bought by
Morris Tanner J and Morris Rachel M
Current Estimated Value
Purchase Details
Closed on
Dec 22, 2020
Sold by
Morris Rachel
Bought by
Morris Tanner James and Morris Rachel Michelle
Home Financials for this Owner
Home Financials are based on the most recent Mortgage that was taken out on this home.
Original Mortgage
$303,750
Outstanding Balance
$214,720
Interest Rate
2.8%
Mortgage Type
New Conventional
Estimated Equity
$407,165
Purchase Details
Closed on
Jan 8, 2015
Sold by
Highrise Homes Llc
Bought by
Morris Rachel
Home Financials for this Owner
Home Financials are based on the most recent Mortgage that was taken out on this home.
Original Mortgage
$191,250
Interest Rate
3.87%
Mortgage Type
New Conventional
Purchase Details
Closed on
Jan 31, 2014
Sold by
Nelson Scott David and Nelson Tami Lynn
Bought by
Highrise Homes Llc
Purchase Details
Closed on
Feb 11, 2009
Sold by
Nixon Charles T
Bought by
Nelson Scott David and Nelson Tami Lynn
Home Financials for this Owner
Home Financials are based on the most recent Mortgage that was taken out on this home.
Original Mortgage
$184,000
Interest Rate
5.01%
Mortgage Type
Unknown
Create a Home Valuation Report for This Property
The Home Valuation Report is an in-depth analysis detailing your home's value as well as a comparison with similar homes in the area
Home Values in the Area
Average Home Value in this Area
Purchase History
| Date | Buyer | Sale Price | Title Company |
|---|---|---|---|
| Morris Tanner J | -- | None Available | |
| Morris Tanner James | -- | Accommodation | |
| Morris Rachel | -- | First American Title | |
| Highrise Homes Llc | -- | Accommodation | |
| Nelson Scott David | -- | First American Title |
Source: Public Records
Mortgage History
| Date | Status | Borrower | Loan Amount |
|---|---|---|---|
| Open | Morris Tanner James | $303,750 | |
| Closed | Morris Rachel | $191,250 | |
| Previous Owner | Nelson Scott David | $184,000 |
Source: Public Records
Tax History
| Year | Tax Paid | Tax Assessment Tax Assessment Total Assessment is a certain percentage of the fair market value that is determined by local assessors to be the total taxable value of land and additions on the property. | Land | Improvement |
|---|---|---|---|---|
| 2025 | $2,920 | $506,100 | $156,600 | $349,500 |
| 2024 | $2,920 | $479,500 | $147,000 | $332,500 |
| 2023 | $2,702 | $439,600 | $139,800 | $299,800 |
| 2022 | $2,839 | $451,200 | $137,100 | $314,100 |
| 2021 | $2,507 | $340,600 | $137,100 | $203,500 |
| 2020 | $2,394 | $307,800 | $91,500 | $216,300 |
| 2019 | $2,257 | $282,700 | $86,300 | $196,400 |
| 2016 | $1,893 | $223,500 | $86,300 | $137,200 |
Source: Public Records
Map
Nearby Homes
- 354 E 7635 South St
- 350 E 7635 South St
- 330 E 7635 S Unit 344
- 7613 S 300 E
- 7579 S 520 E
- 7640 S Quail Springs Cir
- 397 E Tractor Dr Unit 103
- 7824 S 280 E
- 7359 S Dewmar Ct W Unit 32
- 489 E 7800 S Unit 2
- 7363 S Dewmar Ct W Unit 33
- 7342 S Seven Tree Ln W Unit 77
- 7329 S Seven Tree Ln W Unit 85
- 7371 S Dewmar Ct W Unit 35
- 7327 S Seven Tree Ln W Unit 86
- 7337 S Seven Tree Ln W Unit 82
- 7343 S Seven Tree Ln Unit 79
- 7355 S Dewmar Ct W Unit 31
- 600 E Briarsprings Cir
- 7432 Green Berry Ct
- 389 E 7670 S Unit B
- 401 E 7670 S
- 377 E 7670 S Unit 379
- 384 Sandy Park Cir
- 394 Sandy Park Cir
- 394 E Sandy Park Cir
- 374 E Sandy Park Cir
- 374 Sandy Park Cir
- 388 E 7670 S Unit 390
- 374 E Sandy Park Cir
- 363 E 7670 S Unit 365
- 413 E 7670 S Unit 415
- 402 E 7670 S Unit 404
- 415 E 7670 S
- 366 Sandy Park Cir
- 404 Sandy Park Cir
- 404 E Sandy Park Cir
- 7687 S 375 E Unit A
- 7687 S 375 E Unit B
- 360 Sandy Park Cir
Your Personal Tour Guide
Ask me questions while you tour the home.