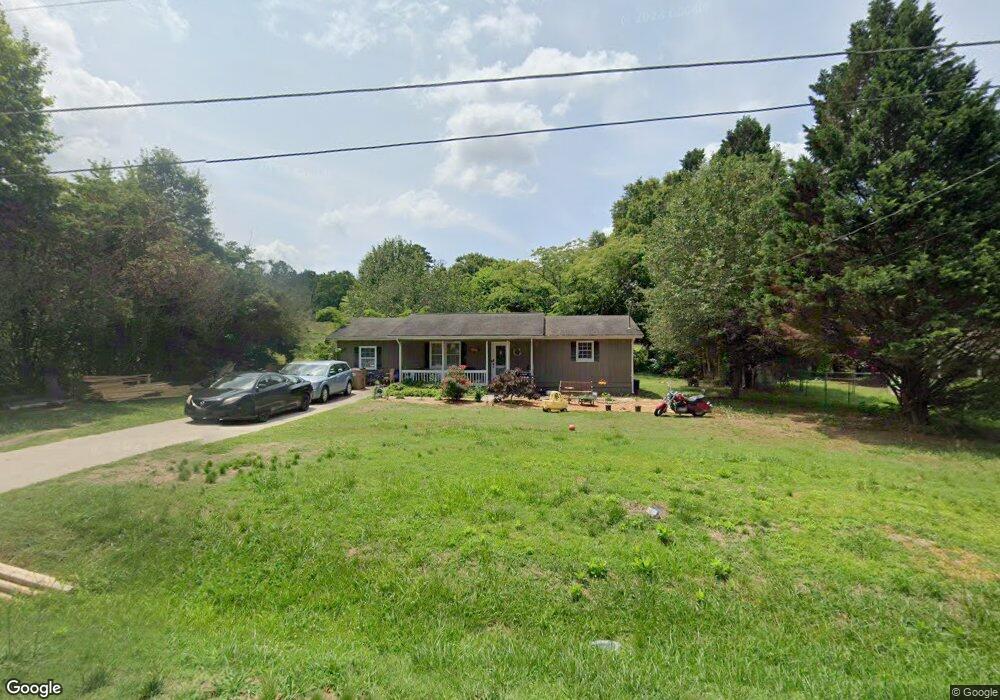
389 E Wright St Winder, GA 30680
Estimated Value: $204,000 - $247,000
3
Beds
2
Baths
1,056
Sq Ft
$219/Sq Ft
Est. Value
About This Home
This home is located at 389 E Wright St, Winder, GA 30680 and is currently estimated at $231,180, approximately $218 per square foot. 389 E Wright St is a home located in Barrow County with nearby schools including Holsenbeck Elementary School, Bear Creek Middle School, and Winder-Barrow High School.
Ownership History
Date
Name
Owned For
Owner Type
Purchase Details
Closed on
Sep 26, 2024
Sold by
Hubert Samuel Hunter Revocable Living Tr
Bought by
Diaz Albino R and Yllescas Luz M
Current Estimated Value
Home Financials for this Owner
Home Financials are based on the most recent Mortgage that was taken out on this home.
Original Mortgage
$239,000
Interest Rate
6.35%
Mortgage Type
New Conventional
Purchase Details
Closed on
Sep 23, 2024
Sold by
Dawg Hunter Investments Llc
Bought by
Hubert Samuel Hunter Revocable Living Tr and Hunter Hubert Samuel Trust
Home Financials for this Owner
Home Financials are based on the most recent Mortgage that was taken out on this home.
Original Mortgage
$239,000
Interest Rate
6.35%
Mortgage Type
New Conventional
Purchase Details
Closed on
Jun 11, 2014
Sold by
Hunter Hubert S
Bought by
Dawg Hunter Investments Llc
Purchase Details
Closed on
Mar 10, 2014
Sold by
J C Perry Investments Llc
Bought by
Hunter Hubert S
Purchase Details
Closed on
Jul 12, 2011
Sold by
Scbt Na
Bought by
J C Perry Investments Llc
Purchase Details
Closed on
May 4, 2010
Sold by
Maddox Harold
Bought by
Community Bk & Trust
Purchase Details
Closed on
Feb 11, 2000
Sold by
Harrison Julia P
Bought by
Maddox Harold E
Home Financials for this Owner
Home Financials are based on the most recent Mortgage that was taken out on this home.
Original Mortgage
$10,107
Interest Rate
8.17%
Mortgage Type
New Conventional
Purchase Details
Closed on
Sep 10, 1979
Bought by
Quinter Robert D
Create a Home Valuation Report for This Property
The Home Valuation Report is an in-depth analysis detailing your home's value as well as a comparison with similar homes in the area
Home Values in the Area
Average Home Value in this Area
Purchase History
| Date | Buyer | Sale Price | Title Company |
|---|---|---|---|
| Diaz Albino R | $239,000 | -- | |
| Hubert Samuel Hunter Revocable Living Tr | -- | -- | |
| Dawg Hunter Investments Llc | -- | -- | |
| Hunter Hubert S | $26,000 | -- | |
| J C Perry Investments Llc | $29,800 | -- | |
| Community Bk & Trust | $23,356 | -- | |
| Maddox Harold E | -- | -- | |
| Quinter Robert D | $28,400 | -- |
Source: Public Records
Mortgage History
| Date | Status | Borrower | Loan Amount |
|---|---|---|---|
| Previous Owner | Diaz Albino R | $239,000 | |
| Previous Owner | Maddox Harold E | $10,107 |
Source: Public Records
Tax History
| Year | Tax Paid | Tax Assessment Tax Assessment Total Assessment is a certain percentage of the fair market value that is determined by local assessors to be the total taxable value of land and additions on the property. | Land | Improvement |
|---|---|---|---|---|
| 2025 | $1,312 | $53,342 | $20,000 | $33,342 |
| 2024 | $1,266 | $50,321 | $18,000 | $32,321 |
| 2023 | $1,077 | $50,321 | $18,000 | $32,321 |
| 2022 | $852 | $28,731 | $10,000 | $18,731 |
| 2021 | $891 | $28,731 | $10,000 | $18,731 |
| 2020 | $848 | $27,194 | $10,000 | $17,194 |
| 2019 | $793 | $24,887 | $10,000 | $14,887 |
| 2018 | $777 | $24,887 | $10,000 | $14,887 |
| 2017 | $650 | $22,333 | $10,000 | $12,333 |
| 2016 | $697 | $22,527 | $10,000 | $12,527 |
| 2015 | $333 | $22,722 | $10,000 | $12,722 |
| 2014 | $577 | $17,816 | $4,900 | $12,916 |
| 2013 | -- | $17,553 | $4,900 | $12,653 |
Source: Public Records
Map
Nearby Homes
- 616 Embassy Walk
- 596 Embassy Walk
- 591 Embassy Walk
- 295 E Wright St
- 92 Chase Cir
- 39 Huckleberry Ln
- 211 Brooks Ln
- 31 Huckleberry Ln
- 24 Lays Ln
- 252 Eastbrook Dr
- 0 Atlanta Hwy SE Unit 10371310
- 414 Grayson Dr
- 72 Shoal Ct
- 74 Shoal Ct
- 76 Shoal Ct
- 260 Westlyn Way
- 337 Mary Alice Dr
- 45 Waverly Ln
- 725 Larry Ln
- 88 Mockingbird Ln Unit 37
- 385 E Wright St
- 396 Meadowview Dr
- 395 E Wright St
- 381 E Wright St
- 392 Meadowview Dr
- 523 Embassy Walk Unit 2B
- 523 Embassy Walk
- 400 Meadowview Dr
- 400 Meadowview Dr Unit A
- 525 Embassy Walk
- 527 Embassy Walk
- 521 Embassy Walk
- 401 E Wright St
- 388 Meadowview Dr
- 377 E Wright St
- 529 Embassy Walk
- 405 E Wright St
- 517 Embassy Walk Unit 1A
- 517 Embassy Walk
- 25 Thetford Way
Your Personal Tour Guide
Ask me questions while you tour the home.