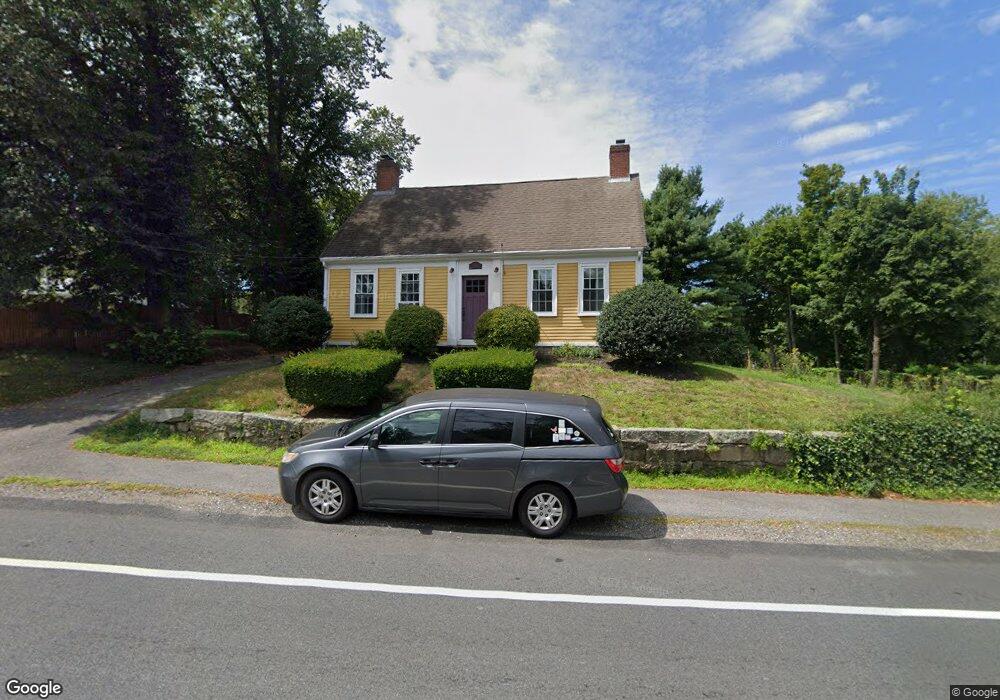
389 Front St Weymouth, MA 02188
Weymouth Landing NeighborhoodEstimated Value: $619,000 - $732,000
3
Beds
2
Baths
1,788
Sq Ft
$375/Sq Ft
Est. Value
About This Home
This home is located at 389 Front St, Weymouth, MA 02188 and is currently estimated at $669,921, approximately $374 per square foot. 389 Front St is a home located in Norfolk County with nearby schools including Frederick C Murphy, Abigail Adams Middle School, and Weymouth Middle School Chapman.
Ownership History
Date
Name
Owned For
Owner Type
Purchase Details
Closed on
May 31, 2001
Sold by
Welch Michael R and Welch Nancy D
Bought by
Hardiman Kelly J
Current Estimated Value
Home Financials for this Owner
Home Financials are based on the most recent Mortgage that was taken out on this home.
Original Mortgage
$211,200
Interest Rate
7.09%
Mortgage Type
Purchase Money Mortgage
Purchase Details
Closed on
Oct 5, 1998
Sold by
Poulos Tr Gordon N
Bought by
Welch Michael R and Welch Nancy D
Home Financials for this Owner
Home Financials are based on the most recent Mortgage that was taken out on this home.
Original Mortgage
$134,500
Interest Rate
6.89%
Mortgage Type
Purchase Money Mortgage
Create a Home Valuation Report for This Property
The Home Valuation Report is an in-depth analysis detailing your home's value as well as a comparison with similar homes in the area
Home Values in the Area
Average Home Value in this Area
Purchase History
| Date | Buyer | Sale Price | Title Company |
|---|---|---|---|
| Hardiman Kelly J | $264,000 | -- | |
| Welch Michael R | $149,500 | -- |
Source: Public Records
Mortgage History
| Date | Status | Borrower | Loan Amount |
|---|---|---|---|
| Open | Welch Michael R | $15,000 | |
| Open | Welch Michael R | $259,000 | |
| Closed | Welch Michael R | $211,200 | |
| Previous Owner | Welch Michael R | $134,500 |
Source: Public Records
Tax History
| Year | Tax Paid | Tax Assessment Tax Assessment Total Assessment is a certain percentage of the fair market value that is determined by local assessors to be the total taxable value of land and additions on the property. | Land | Improvement |
|---|---|---|---|---|
| 2025 | $5,233 | $518,100 | $215,400 | $302,700 |
| 2024 | $5,069 | $493,600 | $205,100 | $288,500 |
| 2023 | $5,042 | $482,500 | $189,900 | $292,600 |
| 2022 | $4,912 | $428,600 | $175,900 | $252,700 |
| 2021 | $4,695 | $399,900 | $175,900 | $224,000 |
| 2020 | $4,505 | $377,900 | $175,900 | $202,000 |
| 2019 | $4,395 | $362,600 | $169,100 | $193,500 |
| 2018 | $4,256 | $340,500 | $161,000 | $179,500 |
| 2017 | $4,120 | $321,600 | $153,400 | $168,200 |
| 2016 | $3,959 | $309,300 | $147,500 | $161,800 |
| 2015 | $3,809 | $295,300 | $147,500 | $147,800 |
| 2014 | $3,583 | $269,400 | $137,300 | $132,100 |
Source: Public Records
Map
Nearby Homes
- 33 Congress St
- 107 Summer St
- 82 Lester Ln
- 15 Summer St
- 116 Greenvale Ave
- 19 Vine St Unit 3
- 19 Vine St Unit 2
- 747 Middle St
- 11 Richmond St
- 25 Richmond St
- 46 Roosevelt Rd
- 122 Washington St Unit Twenty-two
- 8 Tara Dr Unit 4
- 8 Tara Dr Unit 5
- 165 Lake Shore Dr
- 501 Commerce Dr Unit 2310
- 501 Commerce Dr Unit 4308
- 73 Ryder Rd
- 37 Lantern Ln
- 211 Roosevelt Rd
Your Personal Tour Guide
Ask me questions while you tour the home.