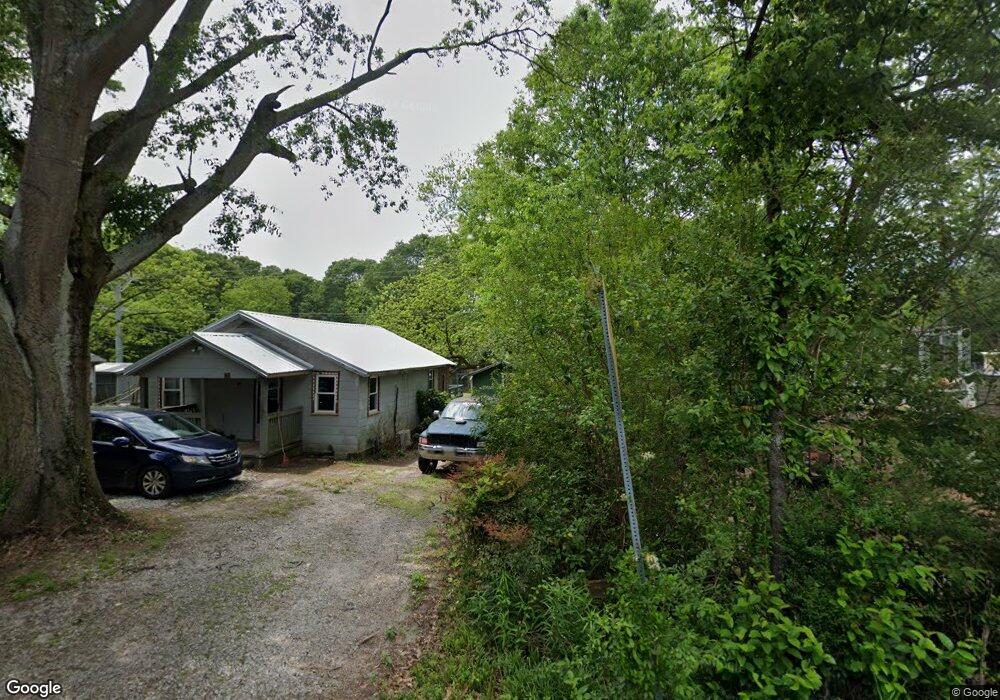
389 Grove St Royston, GA 30662
Estimated Value: $37,155 - $139,000
2
Beds
1
Bath
696
Sq Ft
$137/Sq Ft
Est. Value
About This Home
This home is located at 389 Grove St, Royston, GA 30662 and is currently estimated at $95,289, approximately $136 per square foot. 389 Grove St is a home located in Franklin County with nearby schools including Franklin County High School, Grace Ranch Academy, and Cornerstone Christian Academy.
Ownership History
Date
Name
Owned For
Owner Type
Purchase Details
Closed on
Jul 18, 2022
Sold by
Hill James P
Bought by
Segars Audrey K
Current Estimated Value
Purchase Details
Closed on
Nov 26, 2001
Sold by
Archer Deborah K
Bought by
Hill James P
Purchase Details
Closed on
Dec 21, 1999
Sold by
Hill James
Bought by
Archer Deborah K
Purchase Details
Closed on
Jun 6, 1994
Bought by
Hill James
Create a Home Valuation Report for This Property
The Home Valuation Report is an in-depth analysis detailing your home's value as well as a comparison with similar homes in the area
Home Values in the Area
Average Home Value in this Area
Purchase History
| Date | Buyer | Sale Price | Title Company |
|---|---|---|---|
| Segars Audrey K | $20,000 | -- | |
| Hill James P | -- | -- | |
| Archer Deborah K | -- | -- | |
| Hill James | $15,200 | -- |
Source: Public Records
Tax History
| Year | Tax Paid | Tax Assessment Tax Assessment Total Assessment is a certain percentage of the fair market value that is determined by local assessors to be the total taxable value of land and additions on the property. | Land | Improvement |
|---|---|---|---|---|
| 2025 | $448 | $13,969 | $6,000 | $7,969 |
| 2024 | $465 | $13,524 | $6,000 | $7,524 |
| 2023 | $473 | $12,840 | $6,000 | $6,840 |
| 2022 | $535 | $19,917 | $10,800 | $9,117 |
| 2021 | $366 | $14,905 | $6,840 | $8,065 |
| 2020 | $339 | $13,704 | $6,840 | $6,864 |
| 2019 | $328 | $13,704 | $6,840 | $6,864 |
| 2018 | $301 | $12,744 | $6,840 | $5,904 |
| 2017 | $312 | $12,744 | $6,840 | $5,904 |
| 2016 | $300 | $11,880 | $6,840 | $5,040 |
| 2015 | -- | $11,880 | $6,840 | $5,040 |
| 2014 | -- | $11,880 | $6,840 | $5,040 |
| 2013 | -- | $11,880 | $6,840 | $5,040 |
Source: Public Records
Map
Nearby Homes
- 857 College St
- 134 Hope St
- 0 Grove St Unit 10688565
- 121 Cook St
- 133 Allen St
- LOT 6 Pine Valley Dr
- 15 Putnam St
- 357 Woodridge Way
- 0 Wildcat Bridge Rd Unit 23872265
- 0 Wildcat Bridge Rd Unit 10544672
- 285 Bowers St
- 340 Floyd St
- 134 College St
- 0 Harper Ln Unit 10672727
- 527 Daniel St
- 0 Hwy 17 Unit 10630850
- 0 Hwy 17 Unit 10630342
- 267 Adams Place Dr
- 603 Springdale Dr
- 92 Timber Ln
Your Personal Tour Guide
Ask me questions while you tour the home.