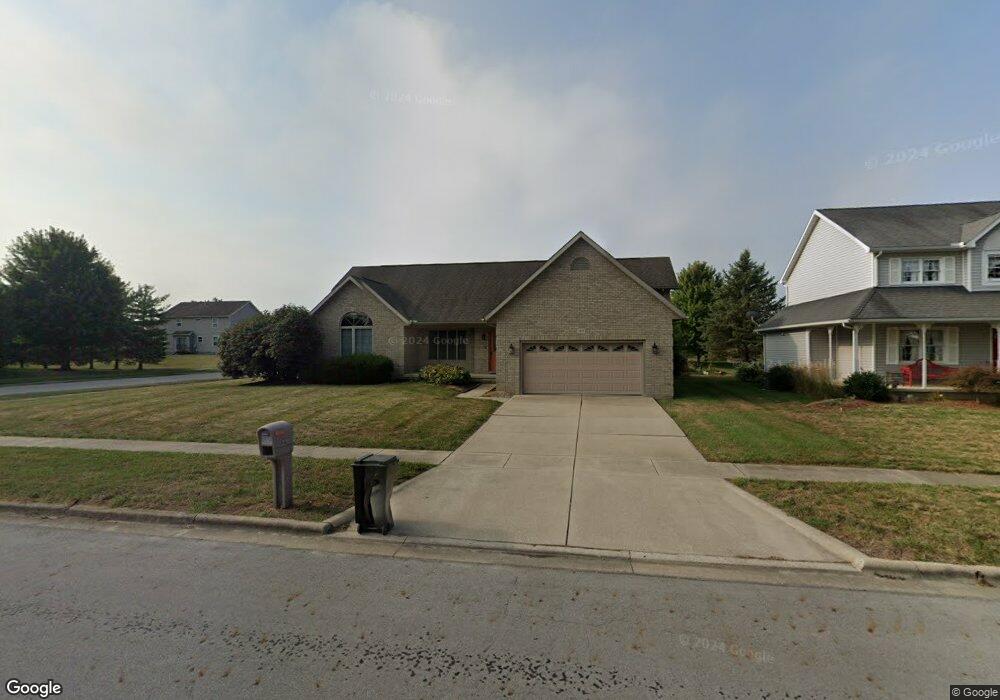
389 Harwich Rd Circleville, OH 43113
Estimated Value: $392,769 - $419,000
About This Home
This home is located at 389 Harwich Rd, Circleville, OH 43113 and is currently estimated at $405,192, approximately $202 per square foot. 389 Harwich Rd is a home located in Pickaway County with nearby schools including Circleville High School and New Hope Christian Academy.
Ownership History
We collect this data history from publicly available records. To have your information removed, we recommend requesting removal directly through your county’s website.
Purchase Details
Home Financials for this Owner
Home Financials are based on the most recent Mortgage that was taken out on this home.Purchase Details
Purchase Details
Purchase Details
Purchase Details
Home Values in the Area
Average Home Value in this Area
Purchase History
We collect this data history from publicly available records. To have your information removed, we recommend requesting removal directly through your county’s website.
| Date | Buyer | Sale Price | Title Company |
|---|---|---|---|
| $190,000 | Transcounty Title | ||
| $34,000 | -- | ||
| $26,500 | -- | ||
| $18,000 | -- | ||
| -- | -- |
Mortgage History
We collect this data history from publicly available records. To have your information removed, we recommend requesting removal directly through your county’s website.
| Date | Status | Borrower | Loan Amount |
|---|---|---|---|
| Open | $152,000 |
Tax History
We collect this data history from publicly available records. To have your information removed, we recommend requesting removal directly through your county’s website.
| Year | Tax Paid | Tax Assessment Tax Assessment Total Assessment is a certain percentage of the fair market value that is determined by local assessors to be the total taxable value of land and additions on the property. | Land | Improvement |
|---|---|---|---|---|
| 2025 | $9,680 | $127,810 | $15,550 | $112,260 |
| 2024 | $9,680 | $127,810 | $15,550 | $112,260 |
| 2023 | $4,481 | $127,810 | $15,550 | $112,260 |
| 2022 | $4,073 | $92,280 | $12,900 | $79,380 |
| 2021 | $4,099 | $92,280 | $12,900 | $79,380 |
| 2020 | $4,098 | $92,280 | $12,900 | $79,380 |
| 2019 | $3,741 | $80,540 | $12,900 | $67,640 |
| 2018 | $3,929 | $80,540 | $12,900 | $67,640 |
| 2017 | $6,390 | $80,540 | $12,900 | $67,640 |
| 2016 | $3,607 | $73,370 | $12,830 | $60,540 |
| 2015 | $3,610 | $73,370 | $12,830 | $60,540 |
| 2014 | $3,699 | $73,370 | $12,830 | $60,540 |
| 2013 | $3,757 | $73,370 | $12,830 | $60,540 |
Map
- 364 Victor Dr
- 352 Victor Dr
- 1540 Shagbark St
- 1545 Shagbark St
- 1556 Georgia Rd
- 1435 Shagbark St
- 1539 Georgia Rd
- 1543 Georgia Rd
- 445 Victor Dr
- 1274 Wilshire Ct
- 1249 Dunhurst St Unit 12495
- 1252 Dunhurst St
- 1291 Stratford Ct
- 1242 Dunhurst St
- 1235 Dunhurst St
- 1205 Dunhurst St Unit 12051
- 676 Fairlawn Dr
- 0 Morris Rd
- 114 Evergreen Ave
- 1756 Jacko Ln
- 383 Harwich Rd
- 1595 Atwater Ave
- 401 Harwich Rd
- 377 Harwich Rd
- 1585 Atwater Ave
- 1560 Pecan Place
- 1631 Atwater Ave
- 1634 Atwater Ave
- 370 Harwich Rd
- 371 Harwich Rd
- 0 Harwich Rd Unit 77420
- 0 Harwich Rd Unit L-132 2231259
- 0 Harwich Rd
- 1575 Atwater Ave
- 320 Victor Dr
- 1550 Pecan Place
- 328 Victor Dr
- 1635 Atwater Ave
- 1565 Pecan Place
- 1565 Atwater Ave
Ask me questions while you tour the home.