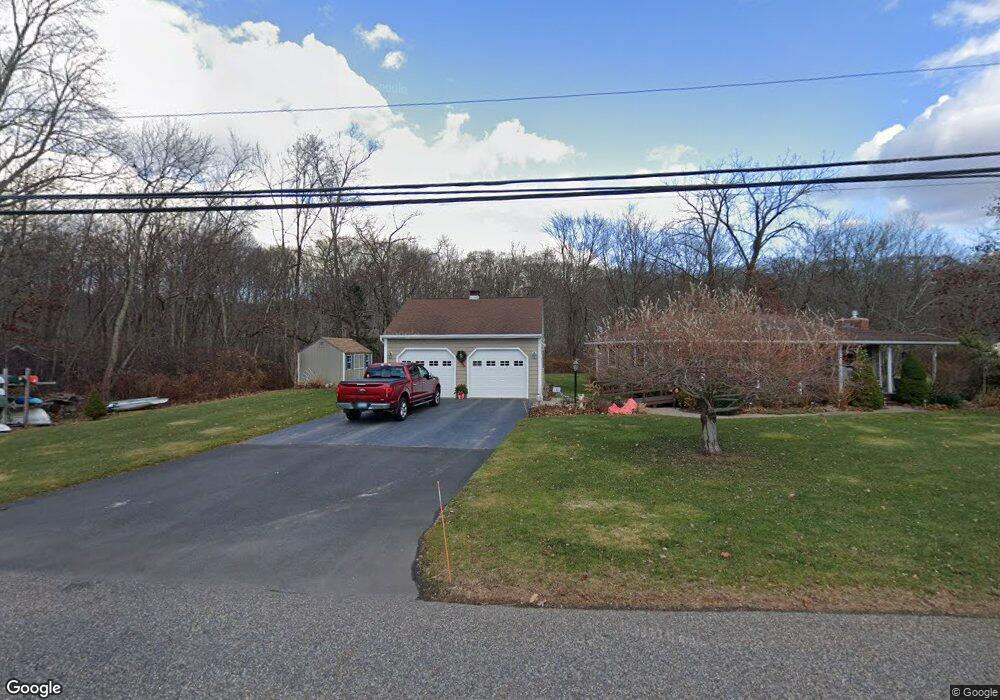
389 Lake Rd Andover, CT 06232
Estimated Value: $336,130 - $425,000
2
Beds
1
Bath
1,012
Sq Ft
$377/Sq Ft
Est. Value
About This Home
This home is located at 389 Lake Rd, Andover, CT 06232 and is currently estimated at $381,033, approximately $376 per square foot. 389 Lake Rd is a home located in Tolland County with nearby schools including Andover Elementary School, RHAM Middle School, and RHAM High School.
Ownership History
Date
Name
Owned For
Owner Type
Purchase Details
Closed on
Jul 1, 2002
Sold by
Gondarowski Leon and Gondarowski Wendy
Bought by
Carroll Priscilla
Current Estimated Value
Purchase Details
Closed on
Aug 15, 1994
Sold by
Kamerer Roger
Bought by
Koczak Marjorie
Create a Home Valuation Report for This Property
The Home Valuation Report is an in-depth analysis detailing your home's value as well as a comparison with similar homes in the area
Home Values in the Area
Average Home Value in this Area
Purchase History
| Date | Buyer | Sale Price | Title Company |
|---|---|---|---|
| Carroll Priscilla | $189,900 | -- | |
| Carroll Priscilla | $189,900 | -- | |
| Koczak Marjorie | $122,000 | -- | |
| Koczak Marjorie | $122,000 | -- |
Source: Public Records
Mortgage History
| Date | Status | Borrower | Loan Amount |
|---|---|---|---|
| Open | Koczak Marjorie | $187,175 | |
| Closed | Koczak Marjorie | $62,000 |
Source: Public Records
Tax History Compared to Growth
Tax History
| Year | Tax Paid | Tax Assessment Tax Assessment Total Assessment is a certain percentage of the fair market value that is determined by local assessors to be the total taxable value of land and additions on the property. | Land | Improvement |
|---|---|---|---|---|
| 2025 | $5,577 | $176,540 | $61,040 | $115,500 |
| 2024 | $5,554 | $176,540 | $61,040 | $115,500 |
| 2023 | $5,524 | $176,540 | $61,040 | $115,500 |
| 2022 | $5,633 | $176,540 | $61,040 | $115,500 |
| 2021 | $5,620 | $156,100 | $79,900 | $76,200 |
| 2020 | $5,591 | $157,000 | $79,900 | $77,100 |
| 2019 | $5,493 | $157,000 | $79,900 | $77,100 |
| 2018 | $5,330 | $157,000 | $79,900 | $77,100 |
| 2017 | $5,103 | $157,000 | $79,900 | $77,100 |
| 2016 | $5,327 | $173,400 | $79,900 | $93,500 |
| 2015 | $5,327 | $173,400 | $79,900 | $93,500 |
| 2014 | $5,327 | $173,400 | $79,900 | $93,500 |
Source: Public Records
Map
Nearby Homes