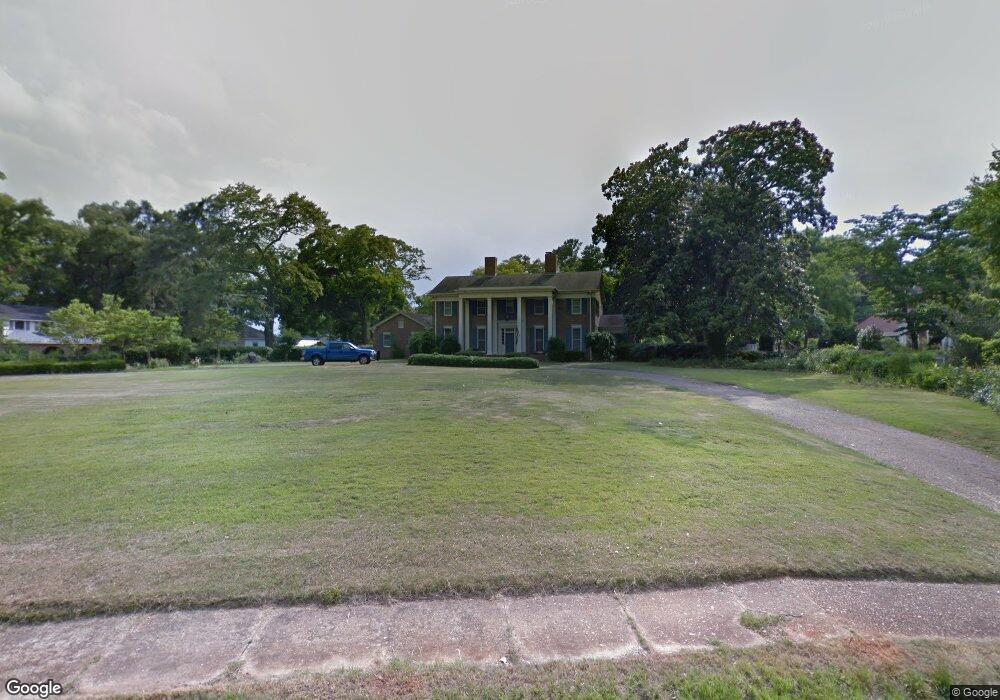
389 Lumpkin St Cuthbert, GA 39840
Estimated Value: $243,000 - $390,000
Studio
4
Baths
3,990
Sq Ft
$77/Sq Ft
Est. Value
About This Home
This home is located at 389 Lumpkin St, Cuthbert, GA 39840 and is currently estimated at $305,319, approximately $76 per square foot. 389 Lumpkin St is a home located in Randolph County with nearby schools including Randolph County Elementary School, Randolph Clay Middle School, and Randolph Clay High School.
Ownership History
Date
Name
Owned For
Owner Type
Purchase Details
Closed on
Sep 19, 2013
Sold by
Coffin Nelson C
Bought by
Coffin Nelson C and Coffin Martha M
Current Estimated Value
Home Financials for this Owner
Home Financials are based on the most recent Mortgage that was taken out on this home.
Original Mortgage
$351,000
Outstanding Balance
$328,994
Interest Rate
2.68%
Mortgage Type
Reverse Mortgage Home Equity Conversion Mortgage
Estimated Equity
-$23,675
Purchase Details
Closed on
Jul 12, 2013
Sold by
Coffin Nelson C
Bought by
Coffin Martha M
Purchase Details
Closed on
Jun 5, 2012
Sold by
Price Sheila A
Bought by
Us Bank National Association
Purchase Details
Closed on
Dec 31, 2007
Sold by
Bickerstaff Shirley M
Bought by
Coffin Nelson C
Purchase Details
Closed on
Jan 1, 1990
Sold by
Burgin R F
Bought by
Burgin Norma A
Create a Home Valuation Report for This Property
The Home Valuation Report is an in-depth analysis detailing your home's value as well as a comparison with similar homes in the area
Home Values in the Area
Average Home Value in this Area
Purchase History
| Date | Buyer | Sale Price | Title Company |
|---|---|---|---|
| Coffin Nelson C | -- | -- | |
| Coffin Nelson C | -- | -- | |
| Coffin Martha M | -- | -- | |
| Coffin Martha M | -- | -- | |
| Us Bank National Association | -- | -- | |
| Us Bank National Association | -- | -- | |
| Coffin Nelson C | $250,000 | -- | |
| Coffin Nelson C | $250,000 | -- | |
| Burgin Norma A | -- | -- |
Source: Public Records
Mortgage History
| Date | Status | Borrower | Loan Amount |
|---|---|---|---|
| Open | Coffin Nelson C | $351,000 |
Source: Public Records
Tax History
| Year | Tax Paid | Tax Assessment Tax Assessment Total Assessment is a certain percentage of the fair market value that is determined by local assessors to be the total taxable value of land and additions on the property. | Land | Improvement |
|---|---|---|---|---|
| 2024 | $5,348 | $106,800 | $10,840 | $95,960 |
| 2023 | $5,000 | $106,800 | $10,840 | $95,960 |
| 2022 | $3,905 | $106,800 | $10,840 | $95,960 |
| 2021 | $2,501 | $67,261 | $7,888 | $59,373 |
| 2020 | $2,573 | $67,261 | $7,888 | $59,373 |
| 2019 | $3,124 | $67,261 | $7,888 | $59,373 |
| 2018 | $3,564 | $77,402 | $6,179 | $71,223 |
| 2017 | $2,817 | $77,402 | $6,179 | $71,223 |
| 2016 | $3,607 | $77,402 | $6,179 | $71,223 |
| 2015 | -- | $98,809 | $7,888 | $90,922 |
| 2014 | -- | $96,412 | $9,106 | $87,306 |
| 2013 | -- | $96,412 | $9,105 | $87,306 |
Source: Public Records
Map
Nearby Homes
- 42 W Harris St
- 349 Highland Ave
- 365 Highland Ave
- 140 College St
- 396 Hood St
- 298 Nelson Coffin Dr
- Mattox Rd
- 0 District Line Rd Unit 10518137
- Old Spring Rd
- Cotton Hill Rd
- 0 Benevolence Hwy Unit 26314983
- Pierce Rd
- 3833 US Highway 82
- 223 Deer Run Rd
- 0 County Rd 70
- 886 Mound Rd
- 3437 Us Highway 82
- Sam Bentley Rd
- XX2 Us-27
- County Road 186
Your Personal Tour Guide
Ask me questions while you tour the home.