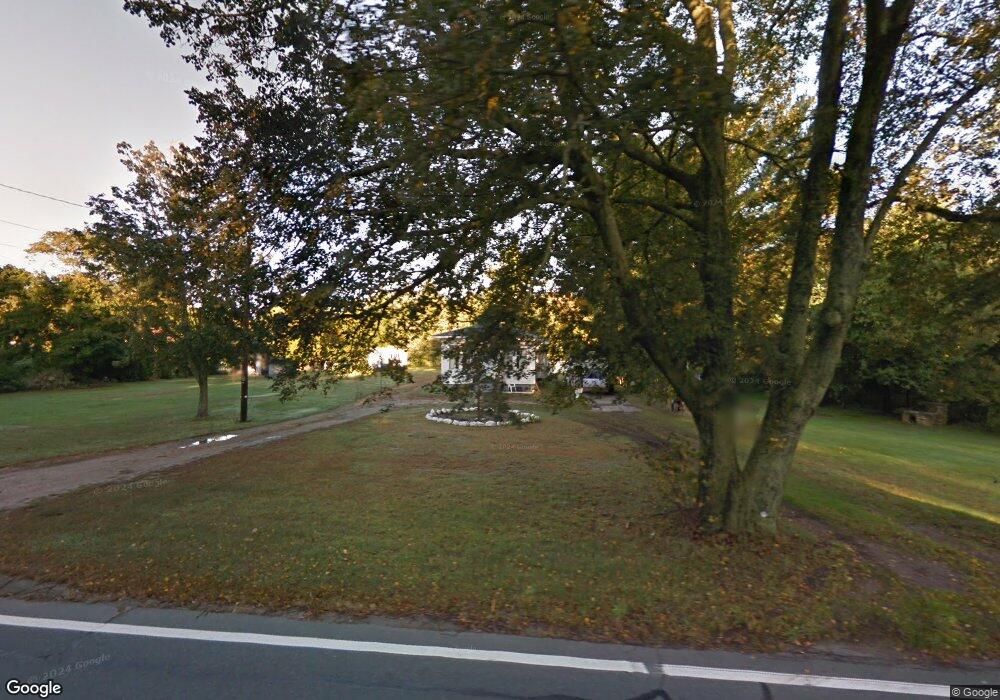
389 Main St Acushnet, MA 02743
Upper Acushnet NeighborhoodEstimated Value: $416,000 - $537,000
Studio
2
Baths
990
Sq Ft
$472/Sq Ft
Est. Value
About This Home
This home is located at 389 Main St, Acushnet, MA 02743 and is currently estimated at $467,623, approximately $472 per square foot. 389 Main St is a home located in Bristol County with nearby schools including Acushnet Elementary School, Albert F Ford Middle School, and Alma Del Mar Charter School.
Ownership History
Date
Name
Owned For
Owner Type
Purchase Details
Closed on
Feb 17, 2020
Sold by
Lhomme Donald A
Bought by
Marani Nt
Current Estimated Value
Purchase Details
Closed on
Aug 6, 2012
Sold by
Lhomme Evelyn A and Lhomme Evelyn
Bought by
Lhomme Donald A
Purchase Details
Closed on
Feb 15, 2012
Sold by
Lhomme Donald A
Bought by
Lhomme Evelyn A
Purchase Details
Closed on
Sep 2, 2009
Sold by
Lhomme Donald A and Lhomme Evelyn A
Bought by
Lhomme Donald A
Create a Home Valuation Report for This Property
The Home Valuation Report is an in-depth analysis detailing your home's value as well as a comparison with similar homes in the area
Home Values in the Area
Average Home Value in this Area
Purchase History
| Date | Buyer | Sale Price | Title Company |
|---|---|---|---|
| Marani Nt | -- | None Available | |
| Lhomme Donald A | -- | -- | |
| Lhomme Evelyn A | -- | -- | |
| Lhomme Donald A | -- | -- |
Source: Public Records
Mortgage History
| Date | Status | Borrower | Loan Amount |
|---|---|---|---|
| Previous Owner | Lhomme Donald A | $130,000 |
Source: Public Records
Tax History
| Year | Tax Paid | Tax Assessment Tax Assessment Total Assessment is a certain percentage of the fair market value that is determined by local assessors to be the total taxable value of land and additions on the property. | Land | Improvement |
|---|---|---|---|---|
| 2025 | $45 | $419,400 | $162,900 | $256,500 |
| 2024 | $4,378 | $383,700 | $154,300 | $229,400 |
| 2023 | $4,166 | $347,200 | $140,000 | $207,200 |
| 2022 | $4,211 | $317,300 | $131,400 | $185,900 |
| 2021 | $4,037 | $291,900 | $131,400 | $160,500 |
| 2020 | $3,951 | $283,400 | $122,900 | $160,500 |
| 2019 | $3,731 | $263,100 | $117,100 | $146,000 |
| 2018 | $5,473 | $263,100 | $117,100 | $146,000 |
| 2017 | $3,623 | $250,900 | $117,100 | $133,800 |
| 2016 | $3,679 | $253,200 | $117,100 | $136,100 |
| 2015 | $3,516 | $246,200 | $117,100 | $129,100 |
Source: Public Records
Map
Nearby Homes
- 363 Main St
- 489 Main St
- 25 Pershing Ave
- 23 Oliveira Ave
- 12 White St
- 0 Hathaway Rd Unit 73469544
- 329 Middle Rd
- 7 Hamlin St
- 191 Hathaway Rd
- 11 Boylston St
- 23 Coury Dr
- 14 Hayes St Unit 1
- 12 Hayes St Unit 1
- 134 Nyes Ln
- 27 Meadow Ln
- 15 Ball St
- 0 Land Way Unit 73479153
- 65 Armsby St
- 1027 Kenmore St
- 122 Truro St
Your Personal Tour Guide
Ask me questions while you tour the home.