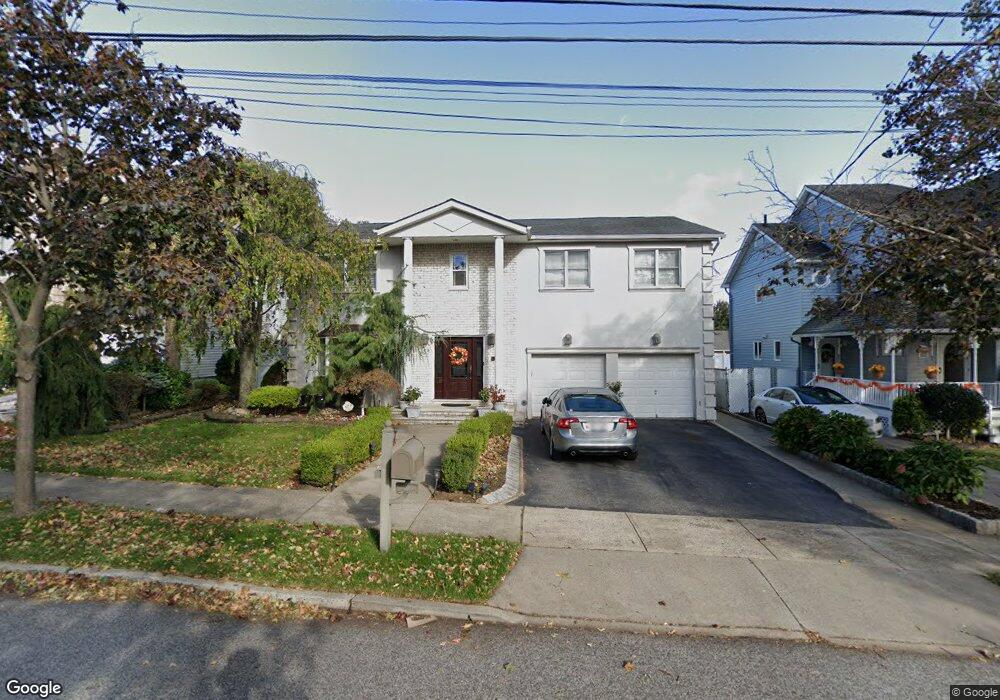
389 Main St Staten Island, NY 10307
Tottenville NeighborhoodEstimated Value: $1,004,598 - $1,193,000
--
Bed
--
Bath
2,700
Sq Ft
$420/Sq Ft
Est. Value
About This Home
This home is located at 389 Main St, Staten Island, NY 10307 and is currently estimated at $1,132,650, approximately $419 per square foot. 389 Main St is a home located in Richmond County with nearby schools including P.S. 1 Tottenville, Is 34 Tottenville, and Tottenville High School.
Ownership History
Date
Name
Owned For
Owner Type
Purchase Details
Closed on
Sep 12, 2005
Sold by
Loverde John and Loverde Lisa
Bought by
Loverde Gerard and Loverde Victoria
Current Estimated Value
Home Financials for this Owner
Home Financials are based on the most recent Mortgage that was taken out on this home.
Original Mortgage
$620,000
Outstanding Balance
$331,493
Interest Rate
5.84%
Mortgage Type
Fannie Mae Freddie Mac
Estimated Equity
$801,157
Create a Home Valuation Report for This Property
The Home Valuation Report is an in-depth analysis detailing your home's value as well as a comparison with similar homes in the area
Home Values in the Area
Average Home Value in this Area
Purchase History
| Date | Buyer | Sale Price | Title Company |
|---|---|---|---|
| Loverde Gerard | $775,000 | -- |
Source: Public Records
Mortgage History
| Date | Status | Borrower | Loan Amount |
|---|---|---|---|
| Open | Loverde Gerard | $620,000 |
Source: Public Records
Tax History Compared to Growth
Tax History
| Year | Tax Paid | Tax Assessment Tax Assessment Total Assessment is a certain percentage of the fair market value that is determined by local assessors to be the total taxable value of land and additions on the property. | Land | Improvement |
|---|---|---|---|---|
| 2025 | $10,758 | $67,260 | $12,591 | $54,669 |
| 2024 | $11,039 | $54,960 | $15,105 | $39,855 |
| 2023 | $10,737 | $54,270 | $14,160 | $40,110 |
| 2022 | $9,934 | $53,880 | $15,060 | $38,820 |
| 2021 | $10,165 | $48,300 | $15,060 | $33,240 |
| 2020 | $9,623 | $46,860 | $15,060 | $31,800 |
| 2019 | $9,316 | $45,960 | $15,060 | $30,900 |
| 2018 | $9,066 | $45,936 | $14,820 | $31,116 |
| 2017 | $8,653 | $43,920 | $15,060 | $28,860 |
| 2016 | $8,288 | $43,010 | $14,452 | $28,558 |
| 2015 | $7,041 | $40,576 | $11,978 | $28,598 |
| 2014 | $7,041 | $38,280 | $12,540 | $25,740 |
Source: Public Records
Map
Nearby Homes
- 153 Carteret St
- 159 Aspinwall St
- 403 Yetman Ave
- 411 Yetman Ave
- 139 Finlay St
- 284 Chelsea St
- 197 Aspinwall St
- 7546 Amboy Rd
- 197 Finlay St
- 9 Massachusetts St
- 342 Chelsea St
- 162 Bentley St
- 329 George St
- 539 Yetman Ave
- 30 Paradise Place
- 24 Sapphire Ct
- 57 Sunset Ln
- 146 Bentley St
- 220 Sprague Ave
- 11 Satterlee St