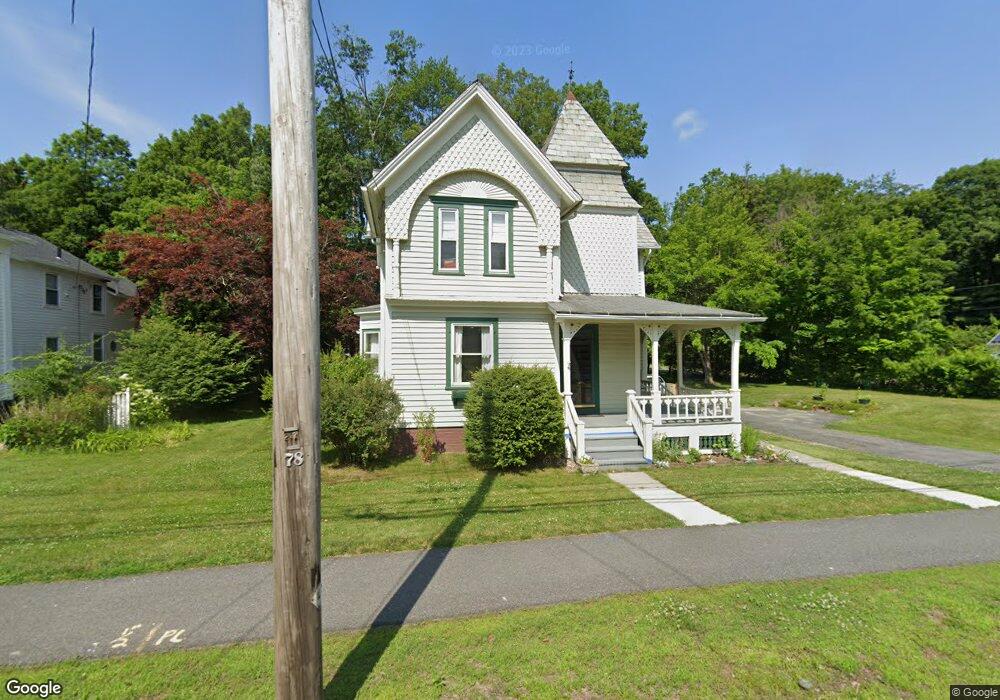
389 Main St Wilbraham, MA 01095
Estimated Value: $419,345 - $488,000
3
Beds
2
Baths
1,917
Sq Ft
$239/Sq Ft
Est. Value
About This Home
This home is located at 389 Main St, Wilbraham, MA 01095 and is currently estimated at $459,086, approximately $239 per square foot. 389 Main St is a home located in Hampden County with nearby schools including Minnechaug Regional High School, Springfield International Charter School, and Wilbraham & Monson Academy.
Ownership History
Date
Name
Owned For
Owner Type
Purchase Details
Closed on
Aug 14, 2002
Sold by
Natcharian Matthew P and Natcharian Lisa M
Bought by
Wilbraham and Monson
Current Estimated Value
Home Financials for this Owner
Home Financials are based on the most recent Mortgage that was taken out on this home.
Original Mortgage
$172,000
Outstanding Balance
$73,094
Interest Rate
6.61%
Mortgage Type
Purchase Money Mortgage
Estimated Equity
$385,992
Purchase Details
Closed on
Feb 25, 1994
Sold by
Triggs Michael E and Triggs Maria E
Bought by
Natcharian Matthew P and Natcharian Lisa M
Home Financials for this Owner
Home Financials are based on the most recent Mortgage that was taken out on this home.
Original Mortgage
$140,400
Interest Rate
6.96%
Mortgage Type
Purchase Money Mortgage
Create a Home Valuation Report for This Property
The Home Valuation Report is an in-depth analysis detailing your home's value as well as a comparison with similar homes in the area
Home Values in the Area
Average Home Value in this Area
Purchase History
| Date | Buyer | Sale Price | Title Company |
|---|---|---|---|
| Wilbraham | $234,500 | -- | |
| Natcharian Matthew P | $156,000 | -- |
Source: Public Records
Mortgage History
| Date | Status | Borrower | Loan Amount |
|---|---|---|---|
| Open | Natcharian Matthew P | $172,000 | |
| Previous Owner | Natcharian Matthew P | $128,000 | |
| Previous Owner | Natcharian Matthew P | $140,400 | |
| Previous Owner | Natcharian Matthew P | $50,000 |
Source: Public Records
Tax History Compared to Growth
Tax History
| Year | Tax Paid | Tax Assessment Tax Assessment Total Assessment is a certain percentage of the fair market value that is determined by local assessors to be the total taxable value of land and additions on the property. | Land | Improvement |
|---|---|---|---|---|
| 2025 | $5,722 | $320,000 | $74,800 | $245,200 |
| 2024 | $5,909 | $319,400 | $74,800 | $244,600 |
| 2023 | $5,071 | $289,500 | $74,800 | $214,700 |
| 2022 | $5,071 | $247,500 | $74,800 | $172,700 |
| 2021 | $4,794 | $208,800 | $80,400 | $128,400 |
| 2020 | $4,673 | $208,800 | $80,400 | $128,400 |
| 2019 | $4,552 | $208,800 | $80,400 | $128,400 |
| 2018 | $4,469 | $197,400 | $80,400 | $117,000 |
| 2017 | $4,343 | $197,400 | $80,400 | $117,000 |
| 2016 | $4,590 | $212,500 | $89,400 | $123,100 |
| 2015 | $4,437 | $212,500 | $89,400 | $123,100 |
Source: Public Records
Map
Nearby Homes
- 2 Bayberry Dr Unit 51
- 8 Patriot Ridge Ln
- 20 Old Orchard Rd
- 28 Decorie Dr
- 6 Hilltop Park
- 474 Mountain Rd
- 68 Monson Rd
- 79 High Pine Cir
- 69 High Pine Cir
- 474-480 Mountain Rd
- 54 High Pine Cir
- 35 Lake Dr
- 2 Vista Rd
- 4 Hillcrest Dr
- 46 Washington Rd
- 6 Teak Terrace Unit 24
- 99 Sandalwood Dr Unit site 00
- 103 Sandalwood Dr Unit site 00
- 57 Sandalwood Dr Unit site 61
- 111 Sandalwood Dr Unit site 00