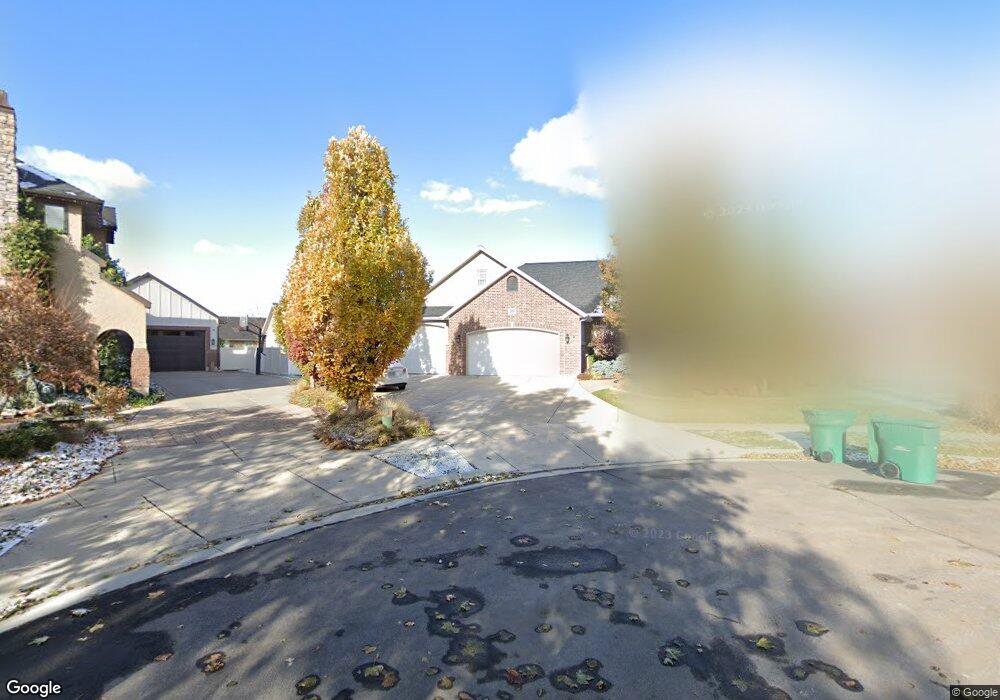
389 N 3050 W Layton, UT 84041
Estimated Value: $672,000 - $912,673
5
Beds
4
Baths
2,439
Sq Ft
$343/Sq Ft
Est. Value
About This Home
This home is located at 389 N 3050 W, Layton, UT 84041 and is currently estimated at $836,418, approximately $342 per square foot. 389 N 3050 W is a home located in Davis County with nearby schools including Sand Springs Elementary School, Legacy Junior High School, and Layton High School.
Ownership History
Date
Name
Owned For
Owner Type
Purchase Details
Closed on
Feb 12, 2025
Sold by
Brandon N Parke And Kathleen Parke Inter and Parke Brandon N
Bought by
Brandon And Kathleen Parke Living Trust and Parke
Current Estimated Value
Purchase Details
Closed on
Sep 19, 2014
Sold by
Parke Brandon N and Parke Kathleen B
Bought by
Brandon N Parke And Kathleen Parke Inter
Purchase Details
Closed on
Oct 30, 2003
Sold by
Mountain Green Development Llc
Bought by
Parke Brandon N and Parke Kathleen B
Create a Home Valuation Report for This Property
The Home Valuation Report is an in-depth analysis detailing your home's value as well as a comparison with similar homes in the area
Home Values in the Area
Average Home Value in this Area
Purchase History
| Date | Buyer | Sale Price | Title Company |
|---|---|---|---|
| Brandon And Kathleen Parke Living Trust | -- | None Listed On Document | |
| Brandon N Parke And Kathleen Parke Inter | -- | None Available | |
| Parke Brandon N | -- | Bonneville Title Company Inc |
Source: Public Records
Tax History Compared to Growth
Tax History
| Year | Tax Paid | Tax Assessment Tax Assessment Total Assessment is a certain percentage of the fair market value that is determined by local assessors to be the total taxable value of land and additions on the property. | Land | Improvement |
|---|---|---|---|---|
| 2025 | $4,401 | $462,000 | $178,375 | $283,625 |
| 2024 | $4,442 | $469,700 | $182,145 | $287,555 |
| 2023 | $4,308 | $803,000 | $211,893 | $591,107 |
| 2022 | $4,635 | $469,150 | $111,289 | $357,861 |
| 2021 | $4,081 | $616,000 | $166,819 | $449,181 |
| 2020 | $3,708 | $537,000 | $145,771 | $391,229 |
| 2019 | $3,737 | $530,000 | $136,253 | $393,747 |
| 2018 | $3,455 | $492,000 | $120,926 | $371,074 |
| 2016 | $3,264 | $239,745 | $54,507 | $185,238 |
| 2015 | $3,069 | $214,005 | $54,507 | $159,498 |
| 2014 | $2,689 | $191,703 | $54,507 | $137,196 |
| 2013 | -- | $201,549 | $47,407 | $154,142 |
Source: Public Records
Map
Nearby Homes