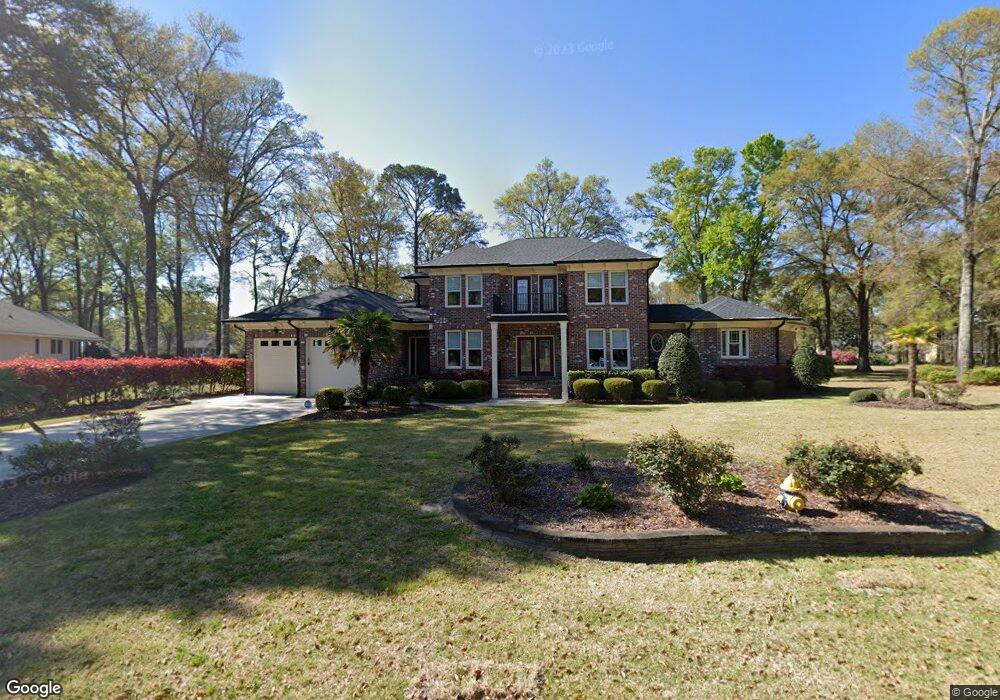
389 Sea Trail Dr W Sunset Beach, NC 28468
Estimated Value: $574,000 - $955,000
5
Beds
4
Baths
3,801
Sq Ft
$221/Sq Ft
Est. Value
About This Home
This home is located at 389 Sea Trail Dr W, Sunset Beach, NC 28468 and is currently estimated at $838,498, approximately $220 per square foot. 389 Sea Trail Dr W is a home located in Brunswick County with nearby schools including Jessie Mae Monroe Elementary School, Shallotte Middle School, and West Brunswick High School.
Ownership History
Date
Name
Owned For
Owner Type
Purchase Details
Closed on
Apr 7, 2017
Sold by
Mann Timothy and Mann Kerry
Bought by
Israelnaim Morris and Israelnaim Elizabeth
Current Estimated Value
Purchase Details
Closed on
Dec 1, 2011
Sold by
Morin Tony J and Morin Jill A
Bought by
Israelnaim Morris and Israelnaim Elizabeth P
Home Financials for this Owner
Home Financials are based on the most recent Mortgage that was taken out on this home.
Original Mortgage
$293,650
Interest Rate
3.37%
Mortgage Type
New Conventional
Purchase Details
Closed on
Aug 7, 2008
Sold by
Morin Pierre and Morin Tracy
Bought by
Morin Tracy Ellen
Purchase Details
Closed on
Jan 2, 2007
Sold by
Morin Brothers Llc
Bought by
Morin Tony J and Morin Pierre D
Create a Home Valuation Report for This Property
The Home Valuation Report is an in-depth analysis detailing your home's value as well as a comparison with similar homes in the area
Home Values in the Area
Average Home Value in this Area
Purchase History
| Date | Buyer | Sale Price | Title Company |
|---|---|---|---|
| Israelnaim Morris | -- | None Available | |
| Israelnaim Morris | $470,000 | None Available | |
| Morin Tracy Ellen | -- | None Available | |
| Morin Tony J | -- | None Available |
Source: Public Records
Mortgage History
| Date | Status | Borrower | Loan Amount |
|---|---|---|---|
| Previous Owner | Israelnaim Morris | $293,650 |
Source: Public Records
Tax History Compared to Growth
Tax History
| Year | Tax Paid | Tax Assessment Tax Assessment Total Assessment is a certain percentage of the fair market value that is determined by local assessors to be the total taxable value of land and additions on the property. | Land | Improvement |
|---|---|---|---|---|
| 2025 | $4,330 | $742,950 | $121,000 | $621,950 |
| 2024 | $4,330 | $742,950 | $121,000 | $621,950 |
| 2023 | $4,428 | $742,950 | $121,000 | $621,950 |
| 2022 | $4,428 | $598,000 | $82,500 | $515,500 |
| 2021 | $4,428 | $598,000 | $82,500 | $515,500 |
| 2020 | $4,428 | $598,000 | $82,500 | $515,500 |
| 2019 | $4,428 | $85,630 | $82,500 | $3,130 |
| 2018 | $3,960 | $86,250 | $82,500 | $3,750 |
| 2017 | $3,797 | $78,750 | $75,000 | $3,750 |
| 2016 | $3,722 | $78,750 | $75,000 | $3,750 |
| 2015 | $3,722 | $530,480 | $75,000 | $455,480 |
| 2014 | $3,300 | $547,861 | $160,000 | $387,861 |
Source: Public Records
Map
Nearby Homes
- 394 Sea Trail Dr W
- 401 Sea Trail Dr W
- 394 Sea Trail Dr E
- 411 Lake Shore Dr
- 289 Heather Dr
- Pembroke Plan at Planters Ridge - Sea Trail
- Hadley Plan at Planters Ridge - Sea Trail
- Foxborough Plan at Planters Ridge - Sea Trail
- Duxbury Plan at Planters Ridge - Sea Trail
- Palmer Plan at Planters Ridge - Sea Trail
- Sagamore Plan at Planters Ridge - Sea Trail
- Holden Plan at Planters Ridge - Sea Trail
- Crooked Gulley Pointe 2 Plan at Planters Ridge - Sea Trail
- Warwick Plan at Planters Ridge - Sea Trail
- Auburn Plan at Planters Ridge - Sea Trail
- Melrose Plan at Planters Ridge - Sea Trail
- Canton Plan at Planters Ridge - Sea Trail
- Santee Modified Plan at Planters Ridge - Sea Trail
- Crooked Gulley Pointe 5 Plan at Planters Ridge - Sea Trail
- Sterling Plan at Planters Ridge - Sea Trail
- 387 Sea Trail Dr W
- 393 Sea Trail Dr W
- 395 Sea Trail Dr W
- 343 Heather Dr
- 342 Sea Trail Dr W
- 344 Heather Dr
- 397 Sea Trail Dr W
- 0 Sea Trail Dr W
- 355 Sea Trail Dr W
- L-129 Sea Trail Dr W
- 10 Sea Trail Dr W
- 218 Olde Oak Ln
- 0 L-21 Olde Oak
- 331 Sea Trail Dr W
- 340 Heather Dr
- 406 Lake Shore Dr
- 216 Olde Oak Ln
- 404 Lake Shore
- 408 Lake Shore Dr
- 312 Shoreline Dr W