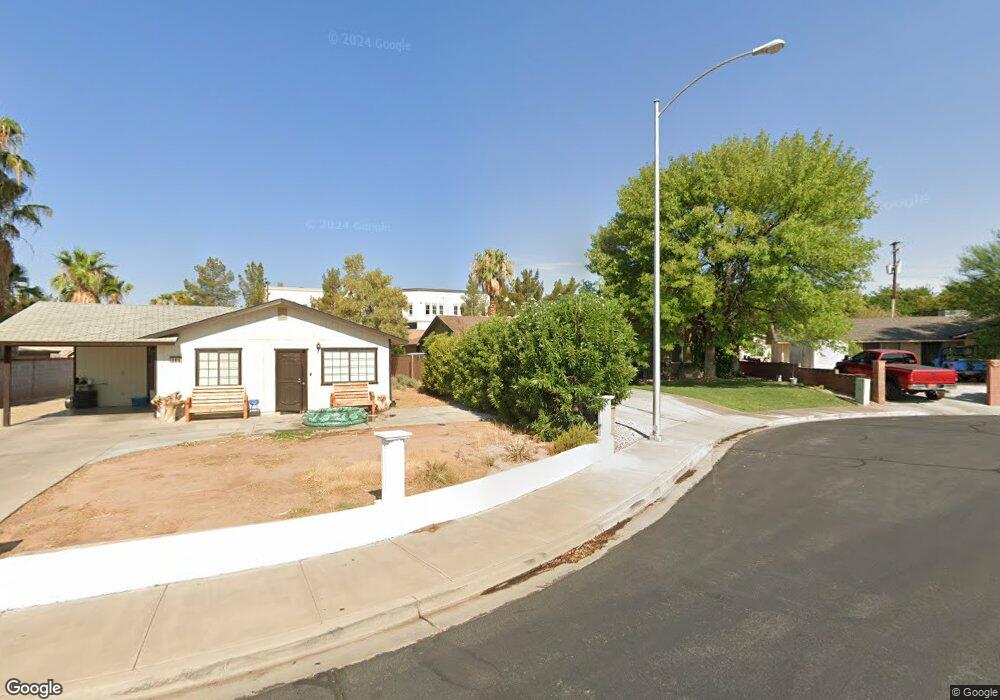
389 Tex St Mesquite, NV 89027
Estimated Value: $394,000 - $456,861
3
Beds
2
Baths
2,578
Sq Ft
$163/Sq Ft
Est. Value
About This Home
This home is located at 389 Tex St, Mesquite, NV 89027 and is currently estimated at $418,965, approximately $162 per square foot. 389 Tex St is a home located in Clark County with nearby schools including Virgin Valley Elementary School, Charles Arthur Hughes Middle School, and Virgin Valley High School.
Ownership History
Date
Name
Owned For
Owner Type
Purchase Details
Closed on
Sep 6, 2016
Sold by
Bruehl Steve J and Bruehl Steven J
Bought by
Bruchi Steven J and Bruchi Pamela J
Current Estimated Value
Home Financials for this Owner
Home Financials are based on the most recent Mortgage that was taken out on this home.
Original Mortgage
$236,500
Outstanding Balance
$188,907
Interest Rate
3.43%
Mortgage Type
New Conventional
Estimated Equity
$230,058
Purchase Details
Closed on
Nov 23, 1999
Sold by
Hodson Randy J
Bought by
Bruehl Steve J and Bruehl Pamela Jo
Home Financials for this Owner
Home Financials are based on the most recent Mortgage that was taken out on this home.
Original Mortgage
$109,650
Interest Rate
10.84%
Purchase Details
Closed on
May 9, 1997
Sold by
Dodd Ron L and Dodd Sharon D
Bought by
Hodson Randy J and Hodson Cheryl D
Home Financials for this Owner
Home Financials are based on the most recent Mortgage that was taken out on this home.
Original Mortgage
$127,205
Interest Rate
7.98%
Mortgage Type
VA
Create a Home Valuation Report for This Property
The Home Valuation Report is an in-depth analysis detailing your home's value as well as a comparison with similar homes in the area
Home Values in the Area
Average Home Value in this Area
Purchase History
| Date | Buyer | Sale Price | Title Company |
|---|---|---|---|
| Bruchi Steven J | -- | None Available | |
| Bruehl Steve J | $129,000 | Fidelity National Title Agen | |
| Hodson Randy J | $123,500 | Fidelity National Title |
Source: Public Records
Mortgage History
| Date | Status | Borrower | Loan Amount |
|---|---|---|---|
| Open | Bruchi Steven J | $236,500 | |
| Previous Owner | Bruehl Steve J | $109,650 | |
| Previous Owner | Hodson Randy J | $127,205 | |
| Closed | Bruehl Steve J | $12,900 |
Source: Public Records
Tax History Compared to Growth
Tax History
| Year | Tax Paid | Tax Assessment Tax Assessment Total Assessment is a certain percentage of the fair market value that is determined by local assessors to be the total taxable value of land and additions on the property. | Land | Improvement |
|---|---|---|---|---|
| 2025 | $2,003 | $102,446 | $19,691 | $82,755 |
| 2024 | $1,945 | $102,446 | $19,691 | $82,755 |
| 2023 | $1,945 | $97,892 | $19,691 | $78,201 |
| 2022 | $1,889 | $90,306 | $18,333 | $71,973 |
| 2021 | $1,834 | $85,156 | $16,636 | $68,520 |
| 2020 | $1,779 | $84,841 | $16,636 | $68,205 |
| 2019 | $1,727 | $80,927 | $13,580 | $67,347 |
| 2018 | $1,368 | $64,561 | $10,864 | $53,697 |
| 2017 | $1,793 | $64,653 | $10,185 | $54,468 |
| 2016 | $1,295 | $65,456 | $10,185 | $55,271 |
| 2015 | $1,292 | $45,229 | $8,488 | $36,741 |
| 2014 | $1,255 | $45,314 | $8,488 | $36,826 |
Source: Public Records
Map
Nearby Homes
- 601 Hillside Dr
- 704 Appletree Ln
- 260 Haley Way Unit 130
- 774 Appletree Ln
- 555 Highland Dr Unit 330
- 813 Mesquite Springs Dr Unit 101
- 334 Colleen Ct Unit D
- 845 Mesquite Springs Dr Unit 102
- 845 Mesquite Springs Dr Unit 101
- 600 Palos Verdes Dr
- 624 Palos Verdes Dr
- 2453 S Tessaro Ct
- 744 Pinnacle Ct
- 819 Palomino Cir
- 433 Canyon Dr
- 518 Plateau Rd
- 931 Chaparral Dr
- 517 W Mesquite Blvd
- 1074 Chaparral Dr
- Residence 2188 Plan at Montrose at Canyon Crest