Estimated Value: $344,154 - $376,000
4
Beds
2
Baths
1,880
Sq Ft
$191/Sq Ft
Est. Value
About This Home
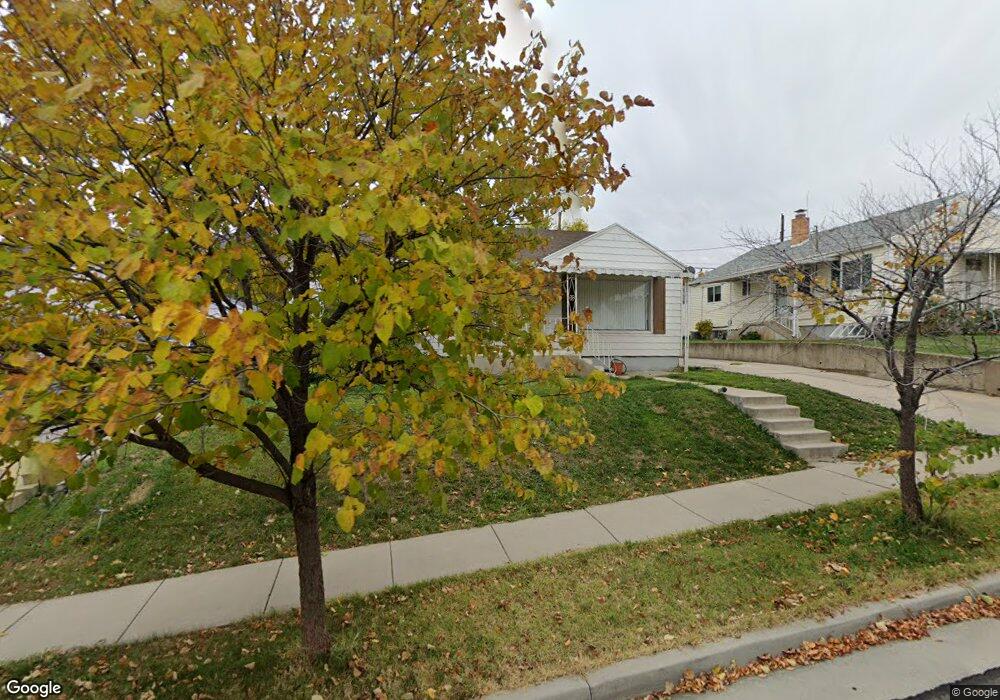
This home is located at 3890 Raymond Ave, Ogden, UT 84403 and is currently estimated at $358,539, approximately $190 per square foot. 3890 Raymond Ave is a home located in Weber County with nearby schools including Burch Creek School, South Ogden Junior High School, and Bonneville High School.
Ownership History
Date
Name
Owned For
Owner Type
Purchase Details
Closed on
Feb 2, 2006
Sold by
Jessop Natalie
Bought by
Dnc Products Llc
Current Estimated Value
Purchase Details
Closed on
Aug 5, 2004
Sold by
Paul Robert K
Bought by
Jessop Natalie
Purchase Details
Closed on
Nov 17, 2000
Sold by
Woodall Alan J and Woodall Robin L
Bought by
Paul Robert K
Home Financials for this Owner
Home Financials are based on the most recent Mortgage that was taken out on this home.
Original Mortgage
$110,092
Interest Rate
7.82%
Purchase Details
Closed on
Feb 22, 1996
Sold by
Healthgarde Corp
Bought by
Woodall Alan J and Woodall Robin L
Home Financials for this Owner
Home Financials are based on the most recent Mortgage that was taken out on this home.
Original Mortgage
$50,436
Interest Rate
7.1%
Mortgage Type
FHA
Create a Home Valuation Report for This Property
The Home Valuation Report is an in-depth analysis detailing your home's value as well as a comparison with similar homes in the area
Home Values in the Area
Average Home Value in this Area
Purchase History
| Date | Buyer | Sale Price | Title Company |
|---|---|---|---|
| Dnc Products Llc | -- | Backman | |
| Jessop Natalie | -- | Premier Title Ins Agency Inc | |
| Paul Robert K | -- | Bonneville Title | |
| Woodall Alan J | -- | First American Title |
Source: Public Records
Mortgage History
| Date | Status | Borrower | Loan Amount |
|---|---|---|---|
| Previous Owner | Paul Robert K | $110,092 | |
| Previous Owner | Woodall Alan J | $50,436 |
Source: Public Records
Tax History Compared to Growth
Tax History
| Year | Tax Paid | Tax Assessment Tax Assessment Total Assessment is a certain percentage of the fair market value that is determined by local assessors to be the total taxable value of land and additions on the property. | Land | Improvement |
|---|---|---|---|---|
| 2025 | $2,553 | $351,241 | $107,501 | $243,740 |
| 2024 | $2,437 | $342,999 | $107,501 | $235,498 |
| 2023 | $2,415 | $343,000 | $108,286 | $234,714 |
| 2022 | $2,654 | $395,000 | $93,461 | $301,539 |
| 2021 | $1,945 | $260,000 | $53,731 | $206,269 |
| 2020 | $1,868 | $233,000 | $39,004 | $193,996 |
| 2019 | $1,652 | $193,001 | $34,039 | $158,962 |
| 2018 | $1,565 | $173,000 | $34,039 | $138,961 |
| 2017 | $1,417 | $148,001 | $31,941 | $116,060 |
| 2016 | $1,241 | $70,703 | $15,362 | $55,341 |
| 2015 | $1,187 | $65,610 | $15,362 | $50,248 |
| 2014 | $1,118 | $60,651 | $15,362 | $45,289 |
Source: Public Records
Map
Nearby Homes
- 3880 Raymond Ave
- 3925 Nordin Ave
- 3874 Orchard Ave
- 3853 Grandview Dr
- 3813 Grandview Dr
- 3868 Grandview Dr
- 3864 S Quincy Ave Unit 119
- 3538 S Quincy Ave
- 4060 S 875 E Unit 54
- 865 Maple St
- 575 40th St
- 516 Diana St
- 1616 S Fowler Ave
- 244 E 40th St S
- 896 E 40th St S
- 855 36th St
- 920 E 4050 S
- 968 Bel Mar Dr
- 964 40th St
- 4075 Jefferson Ave
- 3898 Raymond Ave
- 3885 Nordin Ave
- 3895 Nordin Ave
- 3875 Nordin Ave
- 3855 Nordin Ave
- 3875 Raymond Ave
- 3850 Raymond Ave
- 3910 Raymond Ave
- 3895 Raymond Ave
- 3865 Raymond Ave
- 3909 Nordin Ave
- 3845 Nordin Ave
- 3901 Raymond Ave
- 3855 Raymond Ave
- 3830 Raymond Ave
- 3920 Raymond Ave
- 3915 Raymond Ave
- 3915 Nordin Ave
- 3835 Nordin Ave
- 3845 Raymond Ave