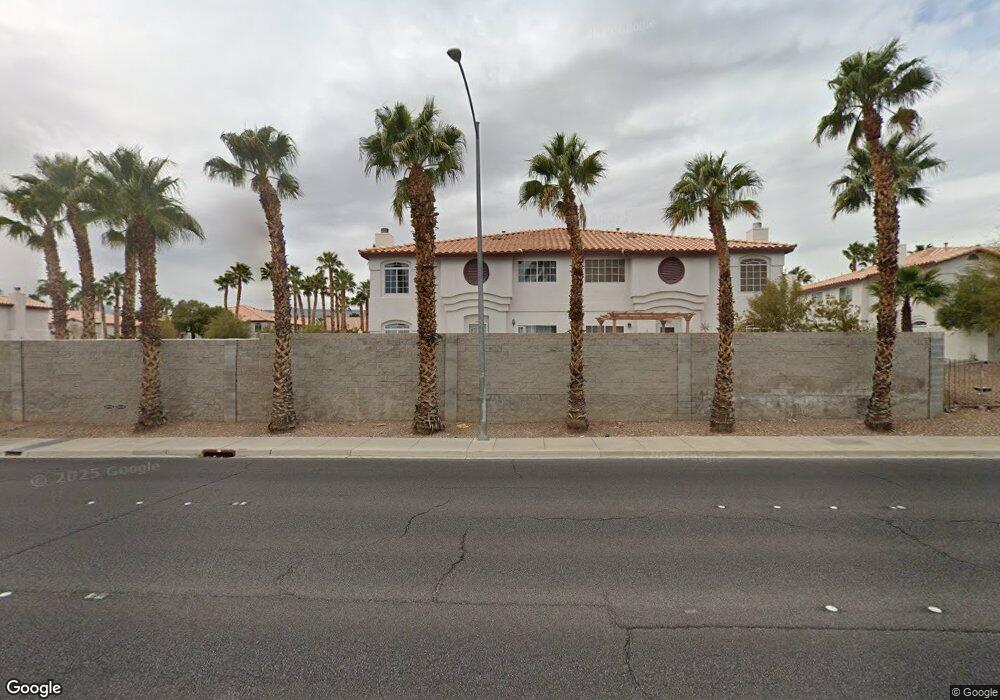
3890 Starfield Ln Unit K43 Las Vegas, NV 89147
Rancho Viejo NeighborhoodEstimated Value: $344,000 - $355,000
3
Beds
3
Baths
1,457
Sq Ft
$240/Sq Ft
Est. Value
About This Home
This home is located at 3890 Starfield Ln Unit K43, Las Vegas, NV 89147 and is currently estimated at $349,359, approximately $239 per square foot. 3890 Starfield Ln Unit K43 is a home located in Clark County with nearby schools including Keith C. & Karen W. Hayes Elementary School, Victoria Fertitta Middle School, and Spring Valley High School.
Ownership History
Date
Name
Owned For
Owner Type
Purchase Details
Closed on
Mar 15, 2017
Sold by
Thompson Samuel Michael and Thompson Carol
Bought by
Thompson Brian A
Current Estimated Value
Home Financials for this Owner
Home Financials are based on the most recent Mortgage that was taken out on this home.
Original Mortgage
$153,765
Outstanding Balance
$127,581
Interest Rate
4.19%
Mortgage Type
New Conventional
Estimated Equity
$221,778
Purchase Details
Closed on
Oct 18, 2002
Sold by
Mcquaig Meriam R
Bought by
Mcquaig Meriam R and The Meriam R Mcquaig Revocable Living Tr
Purchase Details
Closed on
Jun 1, 1998
Sold by
New Starfire Townhomes Llc
Bought by
Mcquaig Meriam R
Home Financials for this Owner
Home Financials are based on the most recent Mortgage that was taken out on this home.
Original Mortgage
$89,200
Interest Rate
7.1%
Create a Home Valuation Report for This Property
The Home Valuation Report is an in-depth analysis detailing your home's value as well as a comparison with similar homes in the area
Home Values in the Area
Average Home Value in this Area
Purchase History
| Date | Buyer | Sale Price | Title Company |
|---|---|---|---|
| Thompson Brian A | $180,900 | Ticor Title Las Vegas | |
| Mcquaig Meriam R | -- | -- | |
| Mcquaig Meriam R | $111,500 | United Title |
Source: Public Records
Mortgage History
| Date | Status | Borrower | Loan Amount |
|---|---|---|---|
| Open | Thompson Brian A | $153,765 | |
| Previous Owner | Mcquaig Meriam R | $89,200 |
Source: Public Records
Tax History Compared to Growth
Tax History
| Year | Tax Paid | Tax Assessment Tax Assessment Total Assessment is a certain percentage of the fair market value that is determined by local assessors to be the total taxable value of land and additions on the property. | Land | Improvement |
|---|---|---|---|---|
| 2025 | $1,192 | $81,293 | $30,450 | $50,843 |
| 2024 | $1,158 | $81,293 | $30,450 | $50,843 |
| 2023 | $1,158 | $69,896 | $23,450 | $46,446 |
| 2022 | $1,124 | $64,452 | $20,300 | $44,152 |
| 2021 | $1,092 | $56,405 | $20,300 | $36,105 |
| 2020 | $1,057 | $57,995 | $20,300 | $37,695 |
| 2019 | $1,026 | $55,309 | $17,850 | $37,459 |
| 2018 | $996 | $49,519 | $13,650 | $35,869 |
| 2017 | $1,414 | $47,594 | $12,250 | $35,344 |
| 2016 | $944 | $44,053 | $8,750 | $35,303 |
| 2015 | $941 | $41,624 | $7,000 | $34,624 |
| 2014 | $914 | $30,147 | $5,950 | $24,197 |
Source: Public Records
Map
Nearby Homes
- 3891 Lilac Haze St
- 3930 Starfield Ln Unit O58
- 9485 Camino Capistrano Ln Unit 1
- 9500 Catalina Cove Cir
- 9272 W Viking Rd
- 9475 Sand Villa Ct
- 9591 Borgata Bay Blvd
- 9615 Sedona Hills Ct
- 9545 Canyonland Ct
- 9718 Camino Capistrano Ln
- 3757 Horseshoe Mesa St
- 3774 Emerald Bay Cir
- 9758 Camino Capistrano Ln
- 3559 S Dapple Gray Rd
- 9587 Windborne Ave
- 3609 Calico Cove Ct
- 3580 Teton Hills St
- 9605 Rainfall Ave
- 9376 Peace Pipe Ct
- 3905 Tropical Vine St
- 3886 Starfield Ln
- 3894 Starfield Ln
- 3882 Starfield Ln
- 3878 Starfield Ln
- 3874 Starfield Ln Unit I35
- 3891 Starfield Ln
- 3870 Starfield Ln
- 3887 Starfield Ln
- 3906 Starfield Ln
- 3902 Starfield Ln
- 3875 Starfield Ln Unit n/a
- 3875 Starfield Ln
- 3910 Starfield Ln
- 3895 Starfield Ln
- 3914 Starfield Ln
- 3871 Starfield Ln Unit 37
- 3907 Starfield Ln
- 3907 Starfield Ln Unit n/a
- 3862 Starfield Ln
- 3858 Starfield Ln