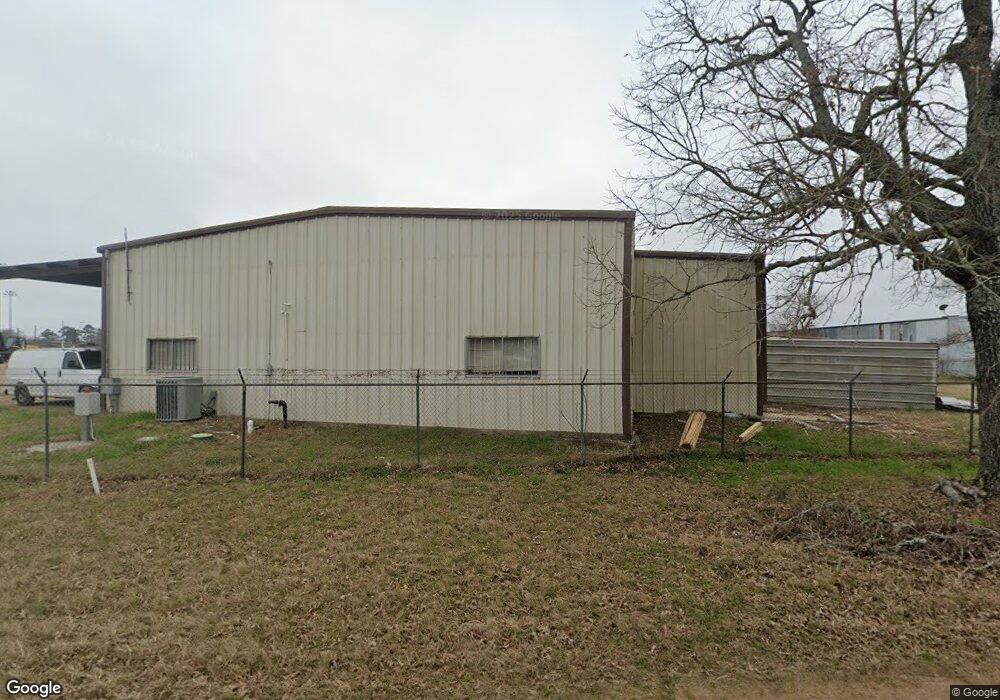
38927A Fm 1774 Rd Magnolia, TX 77355
Estimated Value: $127,429
--
Bed
1
Bath
804
Sq Ft
$158/Sq Ft
Est. Value
About This Home
This home is located at 38927A Fm 1774 Rd, Magnolia, TX 77355 and is currently priced at $127,429, approximately $158 per square foot. 38927A Fm 1774 Rd is a home located in Montgomery County with nearby schools including Magnolia Elementary School, Magnolia Sixth Grade Campus, and Magnolia Junior High School.
Ownership History
Date
Name
Owned For
Owner Type
Purchase Details
Closed on
Dec 7, 2020
Sold by
Clearlake Asset Management Llc
Bought by
Alta Development Group Llc
Current Estimated Value
Purchase Details
Closed on
Mar 23, 2012
Sold by
Bailey Rebbeca
Bought by
Bell Dale and Rebecca Bailey
Purchase Details
Closed on
Sep 9, 2010
Sold by
Darington David G Sutherland and Darington Judy Kay
Bought by
Bailey Rebecca
Purchase Details
Closed on
Sep 23, 2004
Sold by
Darington Judy Kay
Bought by
Bell Dale and Rebecca Bailey
Purchase Details
Closed on
Jul 27, 1999
Sold by
Braband August
Bought by
Eaton David H
Purchase Details
Closed on
Jul 23, 1999
Sold by
Veltman Elizabeth Anne
Bought by
Eaton David H
Purchase Details
Closed on
Jul 12, 1999
Sold by
Braband Johnnie
Bought by
Eaton David H
Create a Home Valuation Report for This Property
The Home Valuation Report is an in-depth analysis detailing your home's value as well as a comparison with similar homes in the area
Home Values in the Area
Average Home Value in this Area
Purchase History
| Date | Buyer | Sale Price | Title Company |
|---|---|---|---|
| Alta Development Group Llc | -- | Alamo Title Company Houston | |
| Bell Dale | -- | -- | |
| Bailey Rebecca | -- | None Available | |
| Bell Dale | -- | -- | |
| Bell Dale | -- | -- | |
| Sutherland David G | -- | -- | |
| Eaton David H | -- | -- | |
| Eaton David H | -- | -- | |
| Eaton David H | -- | -- | |
| Eaton David H | -- | -- |
Source: Public Records
Tax History Compared to Growth
Tax History
| Year | Tax Paid | Tax Assessment Tax Assessment Total Assessment is a certain percentage of the fair market value that is determined by local assessors to be the total taxable value of land and additions on the property. | Land | Improvement |
|---|---|---|---|---|
| 2025 | $1,034 | $56,361 | $19,071 | $37,290 |
| 2024 | $1,078 | $56,360 | $19,070 | $37,290 |
| 2023 | $1,078 | $57,540 | $19,070 | $38,470 |
| 2022 | $1,231 | $57,540 | $19,070 | $38,470 |
| 2021 | $1,209 | $49,850 | $21,890 | $27,960 |
| 2020 | $1,240 | $49,850 | $21,890 | $27,960 |
| 2019 | $1,117 | $45,000 | $21,890 | $23,110 |
| 2018 | $913 | $35,370 | $12,260 | $23,110 |
| 2017 | $914 | $35,370 | $12,260 | $23,110 |
| 2016 | $914 | $35,370 | $12,260 | $23,110 |
| 2015 | $867 | $33,230 | $8,760 | $24,470 |
| 2014 | $867 | $33,230 | $8,760 | $24,470 |
Source: Public Records
Map
Nearby Homes
- 38910 Fm 1774 Rd
- 100 Sterling River Ln
- 38214 E Sulphur Creek Dr
- 30607 N Sulphur Creek Dr
- 163 Sterling River Ln
- 201 Douglas Hills Dr
- 309 Cumberland Forest Dr
- 177 Sterling River Ln
- 213 Douglas Hills Dr
- 205 Douglas Hills Dr
- Springsteen Plan at Magnolia Ridge - Watermill Collection
- Joplin Plan at Magnolia Ridge - Watermill Collection
- Oxford Plan at Magnolia Ridge - Watermill Collection
- Walsh Plan at Magnolia Ridge - Watermill Collection
- Nash Plan at Magnolia Ridge - Watermill Collection
- Ramsey Plan at Magnolia Ridge - Watermill Collection
- Newlin Plan at Magnolia Ridge - Watermill Collection
- Littleton Plan at Magnolia Ridge - Watermill Collection
- Beckman Plan at Magnolia Ridge - Watermill Collection
- 217 Douglas Hills Dr
- 38927 Fm 1774 Rd Unit 9
- 0 David St
- 38925 Fm 1774 Rd
- 0 Fm 1774 Unit 9873012
- 0 Fm 1774 Unit 7120625
- 0 Fm 1774 Unit 9228447
- 0 Fm 1774 Unit 6858199
- 0 Fm 1774 Unit 1405765
- 0 Fm 1774 Unit 5625321
- 0 Fm 1774 Unit 12864774
- 0 Fm 1774 Unit 6669051
- 0 Fm 1774 Unit 80367673
- 0 Fm 1774 Unit 6973424
- 0 Fm 1774 Unit 5888528
- 0 Fm 1774 Unit 40994752
- 0 Fm 1774 Unit 58909994
- 0 Fm 1774 Unit 46632059
- 0 Fm 1774 Unit 25405842
- 0 Fm 1774 Unit 91234125
- 0 Fm 1774 Unit 97563655