3896 Reading Rd Unit 1 Cincinnati, OH 45229
North Avondale NeighborhoodEstimated Value: $78,000 - $167,000
About This Home
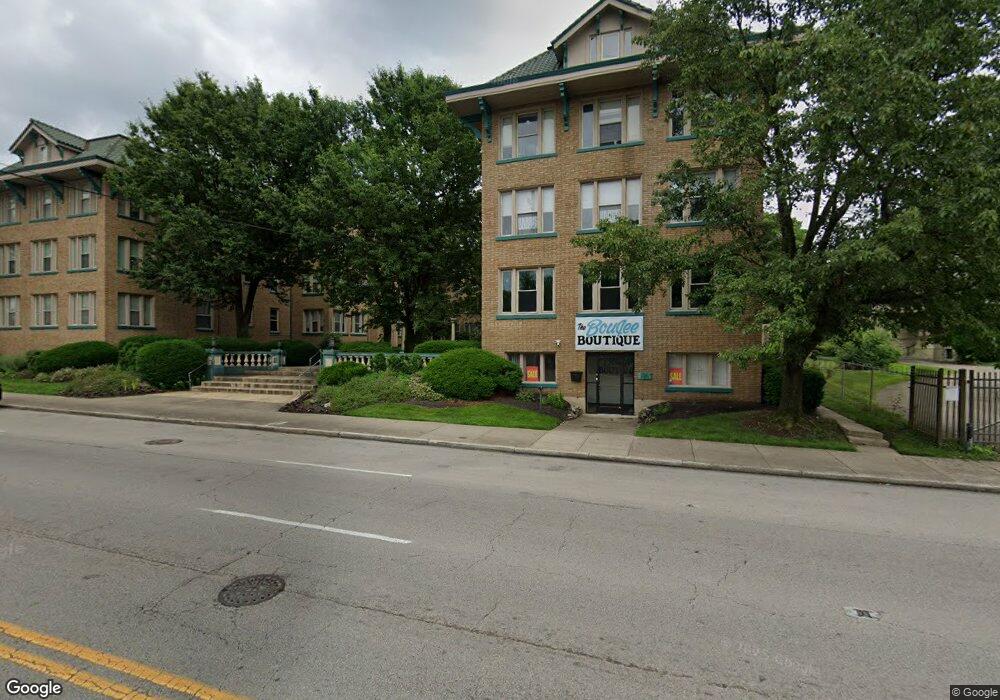
This home is located at 3896 Reading Rd Unit 1, Cincinnati, OH 45229 and is currently estimated at $129,897, approximately $55 per square foot. 3896 Reading Rd Unit 1 is a home located in Hamilton County with nearby schools including South Avondale School, Clark Montessori High School, and Shroder High School.
Ownership History
We collect this data history from publicly available records. To have your information removed, we recommend requesting removal directly through your county’s website.
Purchase Details
Home Financials for this Owner
Home Financials are based on the most recent Mortgage that was taken out on this home.Purchase Details
Purchase Details
Purchase Details
Purchase Details
Home Values in the Area
Average Home Value in this Area
Purchase History
We collect this data history from publicly available records. To have your information removed, we recommend requesting removal directly through your county’s website.
| Date | Buyer | Sale Price | Title Company |
|---|---|---|---|
| $78,500 | Attorney | ||
| -- | Attorney | ||
| -- | Attorney | ||
| -- | None Available | ||
| $133,000 | -- | ||
| $113,900 | -- |
Mortgage History
We collect this data history from publicly available records. To have your information removed, we recommend requesting removal directly through your county’s website.
| Date | Status | Borrower | Loan Amount |
|---|---|---|---|
| Open | $63,500 |
Tax History
We collect this data history from publicly available records. To have your information removed, we recommend requesting removal directly through your county’s website.
| Year | Tax Paid | Tax Assessment Tax Assessment Total Assessment is a certain percentage of the fair market value that is determined by local assessors to be the total taxable value of land and additions on the property. | Land | Improvement |
|---|---|---|---|---|
| 2025 | $1,510 | $24,507 | $2,800 | $21,707 |
| 2023 | $1,497 | $24,507 | $2,800 | $21,707 |
| 2022 | $1,320 | $19,376 | $4,025 | $15,351 |
| 2021 | $1,270 | $19,376 | $4,025 | $15,351 |
| 2020 | $1,308 | $19,376 | $4,025 | $15,351 |
| 2019 | $2,025 | $27,475 | $4,025 | $23,450 |
| 2018 | $2,029 | $27,475 | $4,025 | $23,450 |
| 2017 | $1,927 | $27,475 | $4,025 | $23,450 |
| 2016 | $724 | $10,150 | $5,250 | $4,900 |
| 2015 | $686 | $10,150 | $5,250 | $4,900 |
| 2014 | $690 | $10,150 | $5,250 | $4,900 |
| 2013 | $702 | $10,150 | $5,250 | $4,900 |
Map
- 3896 Reading Rd
- 3966 Rose Hill Ave
- 3900 Rose Hill Ave
- 3990 Beechwood Ave
- 798 Clinton Springs Ave
- 4009 Beechwood Ave
- 961 Marion Ave
- 4150 Paddock Rd
- 4 Burton Woods Ln
- 775 Clinton Springs Ave
- 945 Dana Ave
- 756 Clinton Springs Ave
- 740 N Fred Shuttlesworth Cir
- 974 Burton Ave
- 1039 Burton Ave
- 990 Burton Ave
- 718 Clinton Springs Ave
- 718 Greenwood Ave
- 708 Greenwood Ave
- 704 Greenwood Ave
- 3896 Reading Rd Unit Q
- 3896 Reading Rd
- 3896 Reading Rd
- 3896 Reading Rd Unit X
- 3896 Reading Rd Unit V
- 3896 Reading Rd Unit B
- 3896 Reading Rd Unit U
- 3896 Reading Rd Unit N
- 3896 Reading Rd Unit L
- 3896 Reading Rd Unit S
- 3896 Reading Rd
- 3896 Reading Rd
- 3896 Reading Rd Unit H
- 3896 Reading Rd Unit Z
- 3896 Reading Rd
- 3896 Reading Rd
- 3896 Reading Rd
- 3896 Reading Rd
- 3896 Reading Rd
- 3896 Reading Rd
Ask me questions while you tour the home.