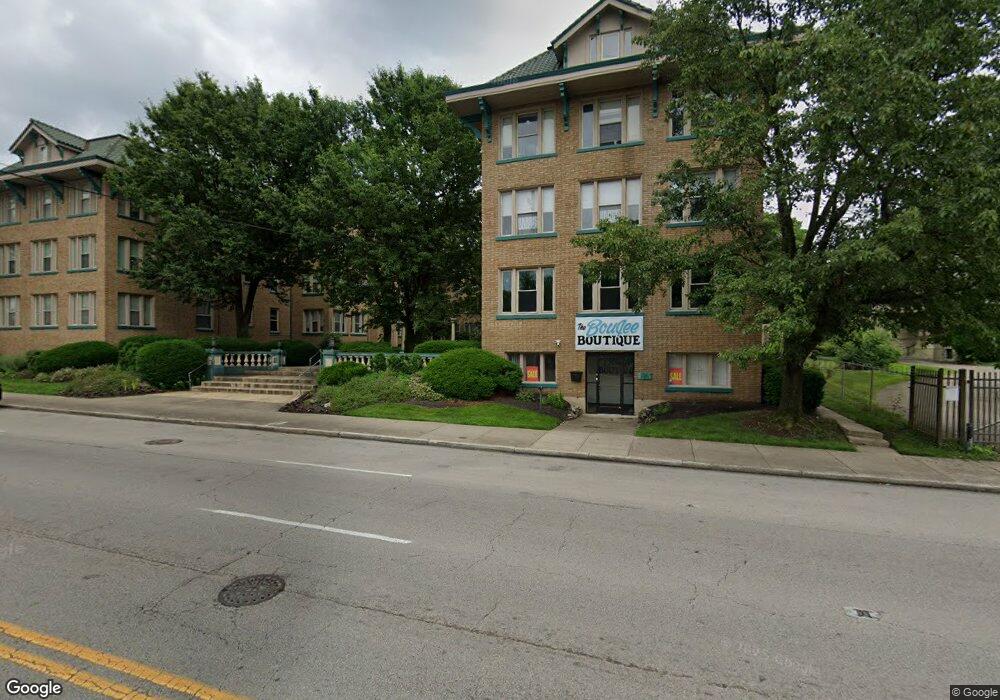
3896 Reading Rd Cincinnati, OH 45229
North Avondale NeighborhoodEstimated Value: $124,000 - $210,000
2
Beds
1
Bath
1,558
Sq Ft
$101/Sq Ft
Est. Value
About This Home
This home is located at 3896 Reading Rd, Cincinnati, OH 45229 and is currently estimated at $157,260, approximately $100 per square foot. 3896 Reading Rd is a home located in Hamilton County with nearby schools including South Avondale School, Clark Montessori High School, and Shroder High School.
Ownership History
Date
Name
Owned For
Owner Type
Purchase Details
Closed on
Jun 1, 2005
Sold by
Lackey Marvin K and Lackey Marvin W
Bought by
Lackey Marvin W
Current Estimated Value
Home Financials for this Owner
Home Financials are based on the most recent Mortgage that was taken out on this home.
Original Mortgage
$11,900
Interest Rate
5.87%
Mortgage Type
Unknown
Purchase Details
Closed on
Apr 12, 2000
Sold by
Pennell Brenda K
Bought by
Lackey Marvin K
Home Financials for this Owner
Home Financials are based on the most recent Mortgage that was taken out on this home.
Original Mortgage
$84,650
Interest Rate
8.24%
Purchase Details
Closed on
Dec 18, 1996
Sold by
Rosehill Realty Ltd
Bought by
Pennell Brenda K
Home Financials for this Owner
Home Financials are based on the most recent Mortgage that was taken out on this home.
Original Mortgage
$75,900
Interest Rate
7.64%
Create a Home Valuation Report for This Property
The Home Valuation Report is an in-depth analysis detailing your home's value as well as a comparison with similar homes in the area
Home Values in the Area
Average Home Value in this Area
Purchase History
| Date | Buyer | Sale Price | Title Company |
|---|---|---|---|
| Lackey Marvin W | -- | Advanced Land Title Agency | |
| Lackey Marvin K | $85,000 | -- | |
| Pennell Brenda K | $79,900 | -- |
Source: Public Records
Mortgage History
| Date | Status | Borrower | Loan Amount |
|---|---|---|---|
| Closed | Lackey Marvin W | $11,900 | |
| Closed | Lackey Marvin W | $87,100 | |
| Closed | Rosehill Realty Ltd | $30,000 | |
| Closed | Lackey Marvin W | $86,500 | |
| Closed | Lackey Marvin K | $84,650 | |
| Previous Owner | Pennell Brenda K | $75,900 |
Source: Public Records
Tax History Compared to Growth
Tax History
| Year | Tax Paid | Tax Assessment Tax Assessment Total Assessment is a certain percentage of the fair market value that is determined by local assessors to be the total taxable value of land and additions on the property. | Land | Improvement |
|---|---|---|---|---|
| 2024 | $1,003 | $16,765 | $2,800 | $13,965 |
| 2023 | $1,026 | $16,765 | $2,800 | $13,965 |
| 2022 | $994 | $14,560 | $4,025 | $10,535 |
| 2021 | $956 | $14,560 | $4,025 | $10,535 |
| 2020 | $984 | $14,560 | $4,025 | $10,535 |
| 2019 | $1,953 | $26,481 | $4,025 | $22,456 |
| 2018 | $1,956 | $26,481 | $4,025 | $22,456 |
| 2017 | $1,858 | $26,481 | $4,025 | $22,456 |
| 2016 | $1,896 | $26,660 | $4,095 | $22,565 |
| 2015 | $1,709 | $26,660 | $4,095 | $22,565 |
| 2014 | $1,722 | $26,660 | $4,095 | $22,565 |
| 2013 | $2,245 | $34,181 | $5,250 | $28,931 |
Source: Public Records
Map
Nearby Homes
- 3896 Reading Rd
- 3900 Rose Hill Ave
- 887 Clinton Springs Ave
- 4150 Paddock Rd
- 766 E Mitchell Ave
- 3903 Winding Way
- 4028 Ledgewood Dr
- 752 S Fred Shuttlesworth Cir
- 700 Clinton Springs Ave
- 708 Greenwood Ave
- 690 Clinton Springs Ave
- 813 S Fred Shuttlesworth Cir
- 3636 Reading Rd
- 3970 Abington Ave
- 3983 Abington Ave
- 918 Glenwood Ave
- 694 Gholson Ave
- 3915 Warwick Ave
- 709 Avon Fields Ln
- 1104 Sunnyslope Dr
- 3896 Reading Rd
- 3896 Reading Rd
- 3896 Reading Rd Unit X
- 3896 Reading Rd Unit 1
- 3896 Reading Rd Unit V
- 3896 Reading Rd Unit B
- 3896 Reading Rd Unit U
- 3896 Reading Rd Unit N
- 3896 Reading Rd Unit L
- 3896 Reading Rd Unit S
- 3896 Reading Rd
- 3896 Reading Rd
- 3896 Reading Rd Unit H
- 3896 Reading Rd Unit Z
- 3896 Reading Rd
- 3896 Reading Rd
- 3896 Reading Rd
- 3896 Reading Rd
- 3896 Reading Rd
- 3896 Reading Rd