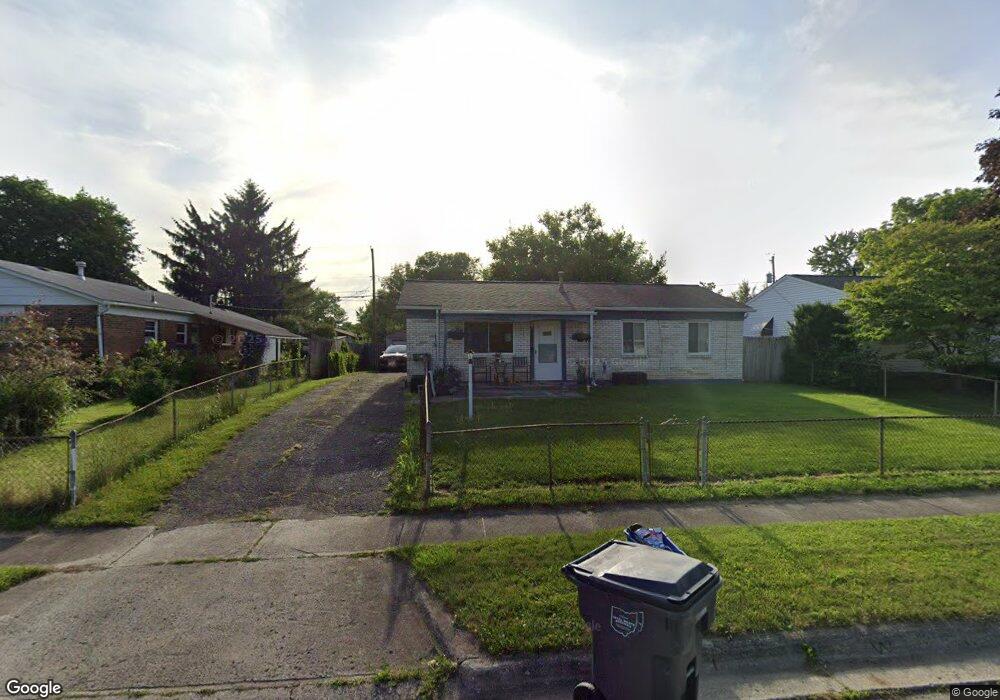
3897 Atkinson Rd Columbus, OH 43232
East Columbus-White Ash NeighborhoodEstimated Value: $167,000 - $257,000
3
Beds
1
Bath
975
Sq Ft
$215/Sq Ft
Est. Value
About This Home
This home is located at 3897 Atkinson Rd, Columbus, OH 43232 and is currently estimated at $209,667, approximately $215 per square foot. 3897 Atkinson Rd is a home located in Franklin County with nearby schools including Groveport Madison High School, A+ Arts Academy, and Eastland Preparatory Academy.
Ownership History
Date
Name
Owned For
Owner Type
Purchase Details
Closed on
Oct 29, 2021
Sold by
Core Developments 4 Llc
Bought by
Core 23 Sfr Llc
Current Estimated Value
Home Financials for this Owner
Home Financials are based on the most recent Mortgage that was taken out on this home.
Original Mortgage
$2,673,000
Interest Rate
2.8%
Mortgage Type
New Conventional
Purchase Details
Closed on
Sep 10, 2021
Sold by
Core Developments 4 Llc
Bought by
Core 23 Sfr Llc
Home Financials for this Owner
Home Financials are based on the most recent Mortgage that was taken out on this home.
Original Mortgage
$2,673,000
Interest Rate
2.8%
Mortgage Type
New Conventional
Purchase Details
Closed on
Dec 12, 2017
Sold by
Poole R Richard and The Poole Family Trust
Bought by
Core Development 4 Llc
Purchase Details
Closed on
Jun 7, 2000
Sold by
Poole Susan E
Bought by
Poole Susan E and Poole Richard R
Purchase Details
Closed on
May 4, 1999
Sold by
Richard Poole R
Bought by
Poole Susan E
Purchase Details
Closed on
Aug 14, 1995
Sold by
Kirk William P
Bought by
Leona M Poole Trst
Home Financials for this Owner
Home Financials are based on the most recent Mortgage that was taken out on this home.
Original Mortgage
$33,000
Interest Rate
7.51%
Mortgage Type
New Conventional
Create a Home Valuation Report for This Property
The Home Valuation Report is an in-depth analysis detailing your home's value as well as a comparison with similar homes in the area
Home Values in the Area
Average Home Value in this Area
Purchase History
| Date | Buyer | Sale Price | Title Company |
|---|---|---|---|
| Core 23 Sfr Llc | -- | Os National Llc | |
| Core 23 Sfr Llc | -- | Os National | |
| Core Development 4 Llc | $45,000 | Pm Title Box | |
| Poole Susan E | -- | -- | |
| Poole Susan E | -- | -- | |
| Poole R Richard | -- | -- | |
| Leona M Poole Trst | $53,000 | -- |
Source: Public Records
Mortgage History
| Date | Status | Borrower | Loan Amount |
|---|---|---|---|
| Previous Owner | Core 23 Sfr Llc | $2,673,000 | |
| Previous Owner | Leona M Poole Trst | $33,000 |
Source: Public Records
Tax History
| Year | Tax Paid | Tax Assessment Tax Assessment Total Assessment is a certain percentage of the fair market value that is determined by local assessors to be the total taxable value of land and additions on the property. | Land | Improvement |
|---|---|---|---|---|
| 2025 | $2,687 | $54,260 | $14,180 | $40,080 |
| 2024 | $2,687 | $54,260 | $14,180 | $40,080 |
| 2023 | $2,669 | $54,250 | $14,175 | $40,075 |
| 2022 | $1,157 | $18,550 | $5,250 | $13,300 |
| 2021 | $1,197 | $18,550 | $5,250 | $13,300 |
| 2020 | $1,200 | $18,550 | $5,250 | $13,300 |
| 2019 | $1,517 | $20,830 | $5,250 | $15,580 |
| 2018 | $1,639 | $20,830 | $5,250 | $15,580 |
| 2017 | $1,536 | $20,830 | $5,250 | $15,580 |
| 2016 | $1,753 | $21,670 | $4,100 | $17,570 |
| 2015 | $1,753 | $21,670 | $4,100 | $17,570 |
| 2014 | $1,608 | $21,670 | $4,100 | $17,570 |
| 2013 | $784 | $24,080 | $4,550 | $19,530 |
Source: Public Records
Map
Nearby Homes
- 3860 Evanston Rd
- 3824 Wade Rd
- 5189 Zimmer Dr
- 5106 Harbor Blvd
- 5044 Albany Dr
- 4980 Harbor Blvd
- 3622 Alpena Rd
- 3493 Tremaine Rd
- 3455 Tremaine Rd
- 3434 Latonia Rd
- 5392 Glendalough St Unit 29
- 5408 Branchville Dr
- 5431 Dungarven St Unit 245
- 3333 Latonia Ct
- 3856 Crestfield Dr Unit 3856
- 4106 Wiston Dr Unit 4106
- 4067 Fitzpatrick Blvd Unit 63
- 3275 Faycrest Rd
- 5508 Arklow Way Unit 117
- 5464 Rohden Dr
- 3889 Atkinson Rd
- 3883 Atkinson Rd
- 3892 Evanston Rd
- 3884 Evanston Rd
- 5290 Cullen Dr
- 3900 Atkinson Rd
- 3876 Evanston Rd
- 3890 Atkinson Rd
- 3869 Atkinson Rd
- 3882 Atkinson Rd
- 3868 Evanston Rd
- 5309 Cullen Dr
- 5315 Cullen Dr
- 5340 Cullen Dr
- 5297 Cullen Dr
- 5321 Cullen Dr
- 3861 Atkinson Rd
- 3870 Atkinson Rd
- 3930 Evanston Rd
- 5329 Cullen Dr
Your Personal Tour Guide
Ask me questions while you tour the home.