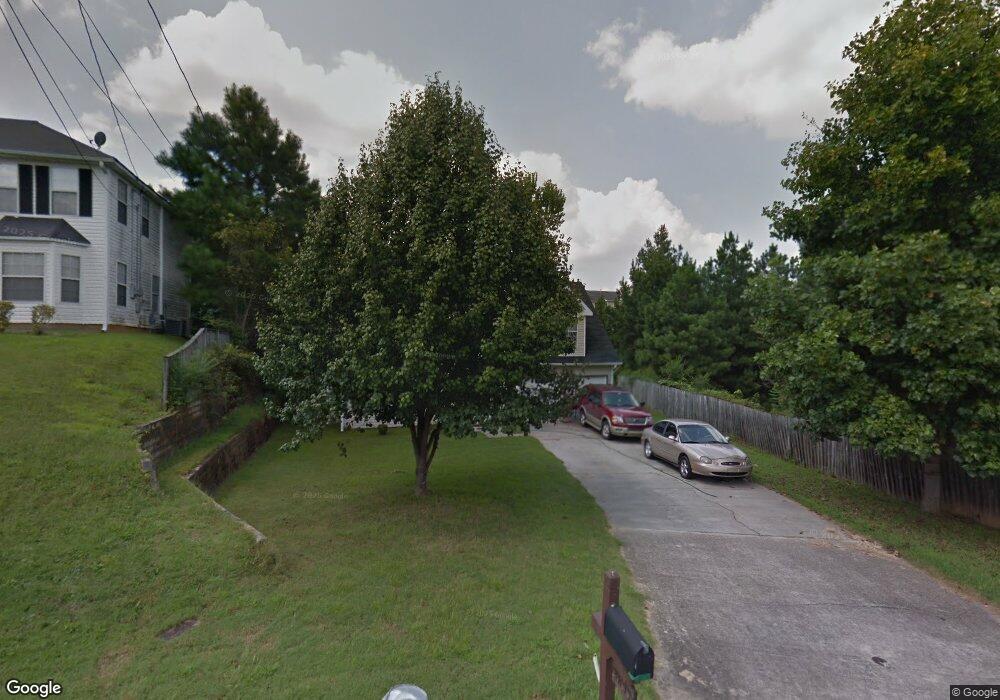
3897 Creek Shoals Ln Unit 1 Ellenwood, GA 30294
Southwest DeKalb NeighborhoodEstimated Value: $275,115 - $299,000
4
Beds
3
Baths
2,088
Sq Ft
$138/Sq Ft
Est. Value
About This Home
This home is located at 3897 Creek Shoals Ln Unit 1, Ellenwood, GA 30294 and is currently estimated at $288,779, approximately $138 per square foot. 3897 Creek Shoals Ln Unit 1 is a home located in DeKalb County with nearby schools including Oakview Elementary School, Cedar Grove Middle School, and Cedar Grove High School.
Ownership History
Date
Name
Owned For
Owner Type
Purchase Details
Closed on
Jun 15, 2024
Sold by
Baker Eleanor L
Bought by
Eleanor L Baker Revocable Living Trust D and Baker Eleanor L Tr
Current Estimated Value
Purchase Details
Closed on
Feb 17, 2014
Sold by
Ellenwood 3719 Trust
Bought by
Gunderson Justin D
Purchase Details
Closed on
Jul 15, 2005
Sold by
Cooper Jeanette L
Bought by
Baker Elenor
Home Financials for this Owner
Home Financials are based on the most recent Mortgage that was taken out on this home.
Original Mortgage
$143,000
Interest Rate
5.64%
Mortgage Type
New Conventional
Purchase Details
Closed on
Jan 31, 2000
Sold by
Riverside Builder Group Inc
Bought by
Cooper Jeanette L
Home Financials for this Owner
Home Financials are based on the most recent Mortgage that was taken out on this home.
Original Mortgage
$123,331
Interest Rate
8.02%
Mortgage Type
FHA
Create a Home Valuation Report for This Property
The Home Valuation Report is an in-depth analysis detailing your home's value as well as a comparison with similar homes in the area
Home Values in the Area
Average Home Value in this Area
Purchase History
| Date | Buyer | Sale Price | Title Company |
|---|---|---|---|
| Eleanor L Baker Revocable Living Trust D | -- | -- | |
| Gunderson Justin D | $97,000 | -- | |
| Baker Elenor | $143,000 | -- | |
| Cooper Jeanette L | $124,400 | -- |
Source: Public Records
Mortgage History
| Date | Status | Borrower | Loan Amount |
|---|---|---|---|
| Previous Owner | Baker Elenor | $143,000 | |
| Previous Owner | Cooper Jeanette L | $123,331 |
Source: Public Records
Tax History Compared to Growth
Tax History
| Year | Tax Paid | Tax Assessment Tax Assessment Total Assessment is a certain percentage of the fair market value that is determined by local assessors to be the total taxable value of land and additions on the property. | Land | Improvement |
|---|---|---|---|---|
| 2024 | $5,061 | $105,520 | $11,680 | $93,840 |
| 2023 | $5,061 | $114,440 | $11,680 | $102,760 |
| 2022 | $4,317 | $90,600 | $11,680 | $78,920 |
| 2021 | $3,471 | $71,320 | $11,680 | $59,640 |
| 2020 | $3,358 | $68,760 | $11,680 | $57,080 |
| 2019 | $3,099 | $62,840 | $11,680 | $51,160 |
| 2018 | $2,524 | $51,000 | $11,680 | $39,320 |
| 2017 | $2,185 | $41,840 | $11,680 | $30,160 |
| 2016 | $2,354 | $45,560 | $11,680 | $33,880 |
| 2014 | $1,527 | $26,200 | $11,680 | $14,520 |
Source: Public Records
Map
Nearby Homes
- 3636 River Heights
- 3604 Cameron Hills Place
- 3664 Hofstra Ct
- 4062 Brookside Pkwy
- 3483 Riverview Chase Dr
- 2373 River Rd
- 3511 Flint Ave
- 3560 Riverchase Dr
- 3529 Mortons Landing Dr
- 3819 Shane Ct
- 3470 River Mill Ln
- 3808 Shane Ct
- 300 Olympian Dr
- 3878 Riverview Chase Bluff
- 4086 River Rd
- 3832 Natalie Way
- 3447 River Mill Ln
- 3740 Brown Dr
- 3903 Creek Shoals Ln
- 3645 River Heights
- 3637 River Heights
- 3655 River Heights Unit 1
- 3892 Creek Shoals Ln
- 3911 Creek Shoals Ln
- 3898 Creek Shoals Ln Unit 37
- 3898 Creek Shoals Ln
- 0 Creek Shoals Ln Unit 8209117
- 0 Creek Shoals Ln Unit 8228760
- 0 Creek Shoals Ln Unit 7534103
- 0 Creek Shoals Ln Unit 3170499
- 0 Creek Shoals Ln Unit 7455109
- 0 Creek Shoals Ln Unit 7509545
- 0 Creek Shoals Ln
- 3633 River Heights
- 3661 River Heights Unit 1
- 3904 Creek Shoals Ln
- 3912 Creek Shoals Ln
- 0 River Heights Unit 8600717