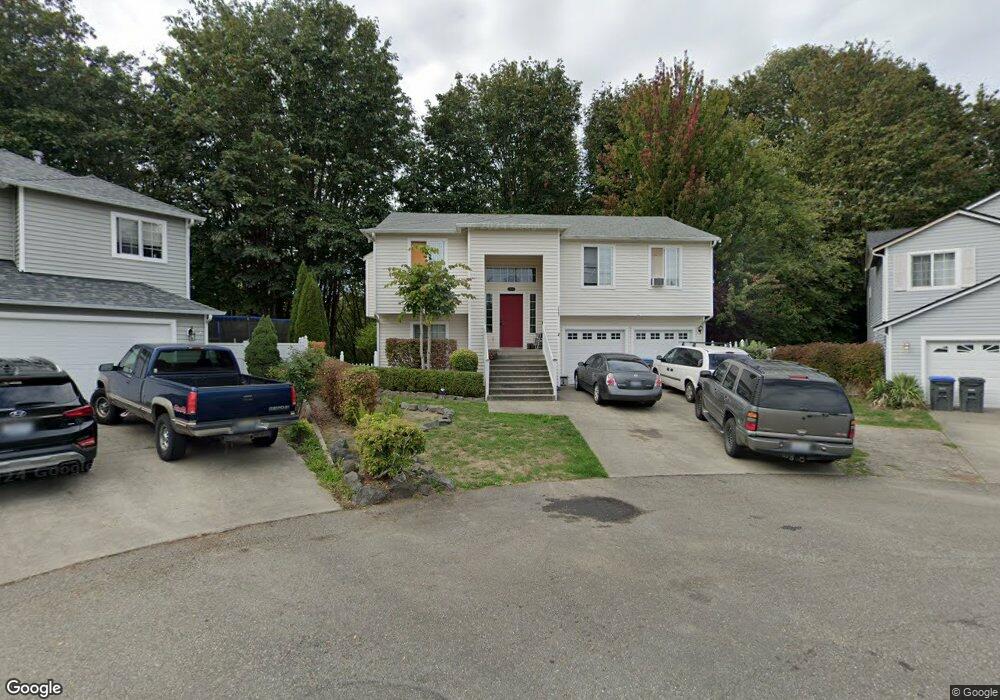
3897 E Sandbar Ct Port Orchard, WA 98366
Parkwood NeighborhoodEstimated Value: $514,396 - $556,000
4
Beds
3
Baths
1,366
Sq Ft
$392/Sq Ft
Est. Value
About This Home
This home is located at 3897 E Sandbar Ct, Port Orchard, WA 98366 and is currently estimated at $536,099, approximately $392 per square foot. 3897 E Sandbar Ct is a home located in Kitsap County with nearby schools including Orchard Heights Elementary School, Marcus Whitman Middle School, and South Kitsap High School.
Ownership History
Date
Name
Owned For
Owner Type
Purchase Details
Closed on
Jun 13, 2006
Sold by
Bader Teddy L and Bader Sharon K
Bought by
Simetz Alan K and Hughes Glenda M
Current Estimated Value
Home Financials for this Owner
Home Financials are based on the most recent Mortgage that was taken out on this home.
Original Mortgage
$46,500
Outstanding Balance
$3,053
Interest Rate
6.57%
Mortgage Type
Stand Alone Second
Estimated Equity
$533,046
Purchase Details
Closed on
Jun 28, 2001
Sold by
Boardwalk Homes Inc
Bought by
Bader Teddy L and Bader Sharon K
Home Financials for this Owner
Home Financials are based on the most recent Mortgage that was taken out on this home.
Original Mortgage
$160,160
Interest Rate
7.14%
Mortgage Type
VA
Create a Home Valuation Report for This Property
The Home Valuation Report is an in-depth analysis detailing your home's value as well as a comparison with similar homes in the area
Home Values in the Area
Average Home Value in this Area
Purchase History
| Date | Buyer | Sale Price | Title Company |
|---|---|---|---|
| Simetz Alan K | $310,280 | First American Title Ins | |
| Bader Teddy L | $156,011 | Chicago Title Insurance Comp |
Source: Public Records
Mortgage History
| Date | Status | Borrower | Loan Amount |
|---|---|---|---|
| Open | Simetz Alan K | $46,500 | |
| Open | Simetz Alan K | $248,000 | |
| Previous Owner | Bader Teddy L | $160,160 |
Source: Public Records
Tax History Compared to Growth
Tax History
| Year | Tax Paid | Tax Assessment Tax Assessment Total Assessment is a certain percentage of the fair market value that is determined by local assessors to be the total taxable value of land and additions on the property. | Land | Improvement |
|---|---|---|---|---|
| 2026 | $3,738 | $453,710 | $68,270 | $385,440 |
| 2025 | $3,738 | $424,200 | $60,480 | $363,720 |
| 2024 | $3,625 | $424,200 | $60,480 | $363,720 |
| 2023 | $3,601 | $424,200 | $60,480 | $363,720 |
| 2022 | $3,524 | $347,820 | $56,480 | $291,340 |
| 2021 | $3,379 | $315,600 | $52,480 | $263,120 |
| 2020 | $3,312 | $300,570 | $49,980 | $250,590 |
| 2019 | $2,861 | $284,630 | $49,070 | $235,560 |
| 2018 | $2,983 | $229,380 | $49,070 | $180,310 |
| 2017 | $2,542 | $229,380 | $49,070 | $180,310 |
| 2016 | $2,479 | $204,630 | $49,070 | $155,560 |
| 2015 | $2,394 | $200,230 | $49,070 | $151,160 |
| 2014 | -- | $195,830 | $49,070 | $146,760 |
| 2013 | -- | $200,070 | $51,650 | $148,420 |
Source: Public Records
Map
Nearby Homes
- 740 Tufts Ave E
- 1242 Lidstrom Rd E
- 1355 Ahlstrom Rd E
- 4258 SE Woodford Ct
- 0 Wendell Ave SE
- 4010 SE Lovell St
- 3140 E Washington St
- 0 E Washington St Unit NWM2337936
- 3900 SE Mile Hill Dr
- 22 Lots E Washington St
- 3930 SE Mile Hill Dr
- 1663 Harrison Ave SE
- 1108 Olney Ave E
- 0 Beach Dr E Unit NWM2139946
- 1400 Baby Doll Rd SE
- 1200 Baby Doll Rd E
- 123 E 4th St
- 2949 SE Mile Hill Dr Unit C7
- 2949 SE Mile Hill Dr Unit C-2
- 4990 Mile Hill Dr
- 3903 E Sandbar Ct
- 3891 E Sandbar Ct
- 3916 E Sandbar Ct
- 3915 E Sandbar Ct
- 2205 Steamboat Loop E
- 2136 Kelp Place E
- 2211 Steamboat Loop E
- 2130 Kelp Place E
- 3927 E Sandbar Ct
- 2124 Kelp Place E
- 2137 Kelp Place E
- 2199 Steamboat Loop E
- 2217 Steamboat Loop E
- 2131 Kelp Place E
- 2118 Kelp Place E
- 2125 Kelp Place E
- 782 Tufts Ave E