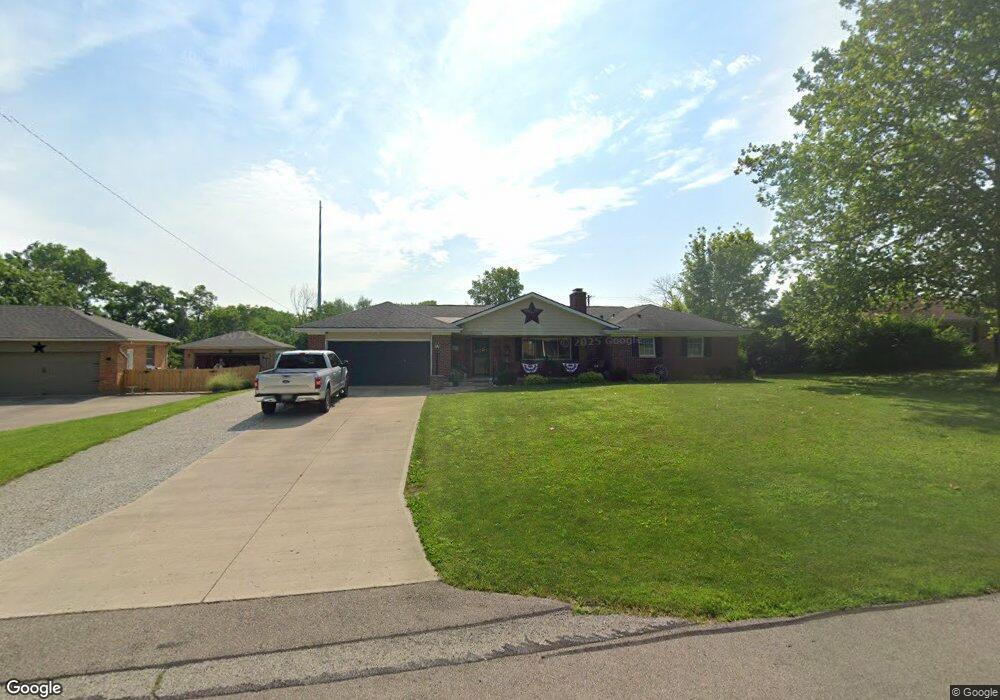
3897 Reinwood Dr Dayton, OH 45414
Estimated Value: $224,414 - $278,000
3
Beds
2
Baths
1,499
Sq Ft
$162/Sq Ft
Est. Value
About This Home
This home is located at 3897 Reinwood Dr, Dayton, OH 45414 and is currently estimated at $242,854, approximately $162 per square foot. 3897 Reinwood Dr is a home located in Montgomery County with nearby schools including Demmitt Elementary School, Smith Middle School, and Butler High School.
Ownership History
Date
Name
Owned For
Owner Type
Purchase Details
Closed on
Jan 7, 2019
Sold by
Treadway Kenneth A
Bought by
Treadway Kenneth A and Hoskins Lisa M
Current Estimated Value
Purchase Details
Closed on
May 10, 2013
Sold by
Beckett Janice C
Bought by
Treadway Kenneth A
Home Financials for this Owner
Home Financials are based on the most recent Mortgage that was taken out on this home.
Original Mortgage
$101,700
Outstanding Balance
$72,195
Interest Rate
3.52%
Mortgage Type
Future Advance Clause Open End Mortgage
Estimated Equity
$170,659
Purchase Details
Closed on
Oct 31, 2005
Sold by
Allen Judy A
Bought by
Sherrill Larry T and Sherrill Carol A
Purchase Details
Closed on
Nov 21, 2002
Sold by
Castles Frank E and Castles Virginia I
Bought by
Castles Frank E and Castles Virginia I
Create a Home Valuation Report for This Property
The Home Valuation Report is an in-depth analysis detailing your home's value as well as a comparison with similar homes in the area
Home Values in the Area
Average Home Value in this Area
Purchase History
| Date | Buyer | Sale Price | Title Company |
|---|---|---|---|
| Treadway Kenneth A | -- | Home Services Title Llc | |
| Treadway Kenneth A | $113,000 | Sterling Title Inc | |
| Sherrill Larry T | $168,000 | -- | |
| Castles Frank E | -- | -- |
Source: Public Records
Mortgage History
| Date | Status | Borrower | Loan Amount |
|---|---|---|---|
| Open | Treadway Kenneth A | $101,700 |
Source: Public Records
Tax History Compared to Growth
Tax History
| Year | Tax Paid | Tax Assessment Tax Assessment Total Assessment is a certain percentage of the fair market value that is determined by local assessors to be the total taxable value of land and additions on the property. | Land | Improvement |
|---|---|---|---|---|
| 2024 | $2,786 | $44,700 | $9,070 | $35,630 |
| 2023 | $2,786 | $44,700 | $9,070 | $35,630 |
| 2022 | $3,089 | $39,560 | $8,550 | $31,010 |
| 2021 | $3,090 | $39,560 | $8,550 | $31,010 |
| 2020 | $3,080 | $39,560 | $8,550 | $31,010 |
| 2019 | $3,061 | $35,860 | $8,550 | $27,310 |
| 2018 | $3,067 | $35,860 | $8,550 | $27,310 |
| 2017 | $3,046 | $35,860 | $8,550 | $27,310 |
| 2016 | $3,327 | $38,480 | $8,550 | $29,930 |
| 2015 | $3,157 | $38,480 | $8,550 | $29,930 |
| 2014 | $3,157 | $38,480 | $8,550 | $29,930 |
| 2012 | -- | $40,420 | $10,500 | $29,920 |
Source: Public Records
Map
Nearby Homes
- 3518 Park Crest Ln
- 678 Deerhurst Dr
- 710 Deerhurst Dr
- 715 Deerhurst Dr
- Fairfax Plan at Foxfire - Maple Street Collection
- Yosemite Plan at Foxfire - Maple Street Collection
- Cumberland Plan at Foxfire - Maple Street Collection
- Jensen Plan at Foxfire - Maple Street Collection
- Beacon Plan at Foxfire - Maple Street Collection
- Wesley Plan at Foxfire - Maple Street Collection
- Breckenridge Plan at Foxfire - Maple Street Collection
- Danville Plan at Foxfire - Maple Street Collection
- DaVinci Plan at Foxfire - Maple Street Collection
- Greenbriar Plan at Foxfire - Maple Street Collection
- 668 Deerhurst Dr
- 679 Deerhurst Dr
- 3600 Little York Rd
- 827 Foxfire Trail
- 3291 Benchwood Rd
- 3320 Benchwood Rd
- 3907 Reinwood Dr
- 3887 Reinwood Dr
- 3917 Reinwood Dr
- 3877 Reinwood Dr
- 3900 Reinwood Dr
- 3882 Reinwood Dr
- 3912 Reinwood Dr
- 3927 Reinwood Dr
- 3867 Reinwood Dr
- 3924 Reinwood Dr
- 3937 Reinwood Dr
- 3857 Reinwood Dr
- 3840 Reinwood Dr
- 4040 Reinwood Dr
- 4032 Reinwood Dr
- 3966 Reinwood Dr
- 3847 Reinwood Dr
- 3947 Reinwood Dr
- 4022 Reinwood Dr
- 3837 Reinwood Dr