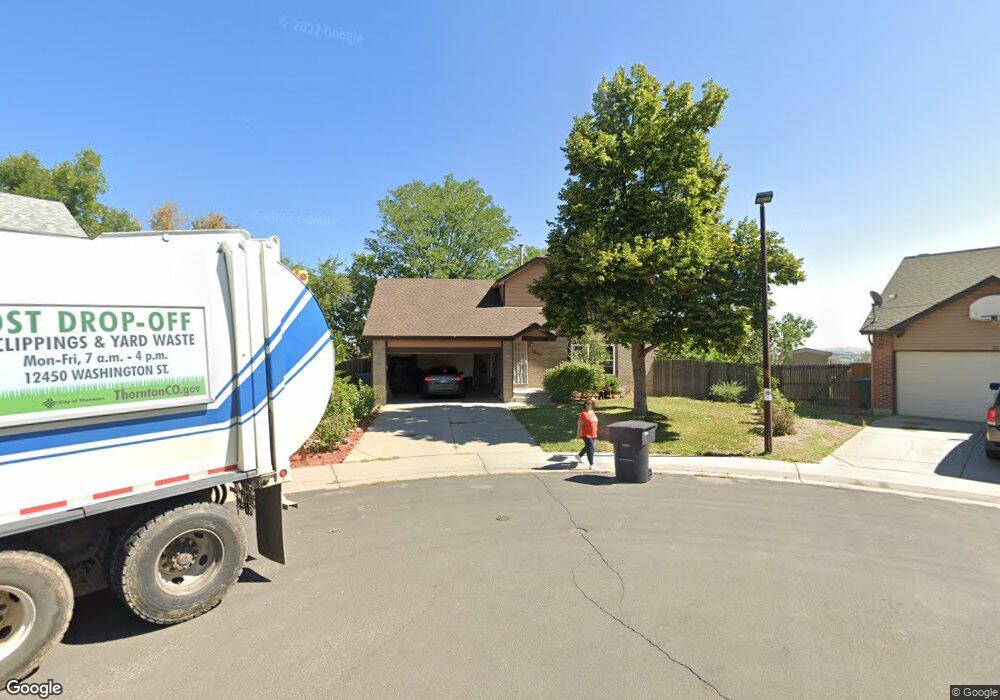
3899 E 99th Cir Thornton, CO 80229
Quimby NeighborhoodEstimated Value: $443,000 - $495,000
3
Beds
2
Baths
1,476
Sq Ft
$311/Sq Ft
Est. Value
About This Home
This home is located at 3899 E 99th Cir, Thornton, CO 80229 and is currently estimated at $459,671, approximately $311 per square foot. 3899 E 99th Cir is a home located in Adams County with nearby schools including Trailside Academy.
Ownership History
Date
Name
Owned For
Owner Type
Purchase Details
Closed on
Dec 19, 2024
Sold by
Hanson Josephine N
Bought by
Hanson Josephine and Pacheco Diana
Current Estimated Value
Home Financials for this Owner
Home Financials are based on the most recent Mortgage that was taken out on this home.
Original Mortgage
$228,937
Interest Rate
6.81%
Mortgage Type
FHA
Purchase Details
Closed on
Oct 6, 2017
Sold by
Hanson Joseph
Bought by
Hanson Joseph
Purchase Details
Closed on
Nov 22, 1993
Sold by
Hanson Glenn
Bought by
Hanson Glenn and Hanson Josephine N
Home Financials for this Owner
Home Financials are based on the most recent Mortgage that was taken out on this home.
Original Mortgage
$77,455
Interest Rate
6.71%
Mortgage Type
FHA
Create a Home Valuation Report for This Property
The Home Valuation Report is an in-depth analysis detailing your home's value as well as a comparison with similar homes in the area
Home Values in the Area
Average Home Value in this Area
Purchase History
| Date | Buyer | Sale Price | Title Company |
|---|---|---|---|
| Hanson Josephine | -- | Cherry Creek Title Services | |
| Hanson Josephine | -- | Cherry Creek Title Services | |
| Hanson Joseph | -- | None Available | |
| Hanson Glenn | -- | Land Title |
Source: Public Records
Mortgage History
| Date | Status | Borrower | Loan Amount |
|---|---|---|---|
| Previous Owner | Hanson Josephine | $228,937 | |
| Previous Owner | Hanson Glenn | $77,455 |
Source: Public Records
Tax History
| Year | Tax Paid | Tax Assessment Tax Assessment Total Assessment is a certain percentage of the fair market value that is determined by local assessors to be the total taxable value of land and additions on the property. | Land | Improvement |
|---|---|---|---|---|
| 2025 | $2,127 | $29,850 | $6,120 | $23,730 |
| 2024 | $2,127 | $27,440 | $5,630 | $21,810 |
| 2023 | $2,109 | $33,080 | $5,750 | $27,330 |
| 2022 | $1,652 | $23,520 | $5,910 | $17,610 |
| 2021 | $1,559 | $23,520 | $5,910 | $17,610 |
| 2020 | $1,435 | $22,570 | $6,080 | $16,490 |
| 2019 | $1,443 | $22,570 | $6,080 | $16,490 |
| 2018 | $1,193 | $19,200 | $5,760 | $13,440 |
| 2017 | $1,870 | $19,200 | $5,760 | $13,440 |
| 2016 | $744 | $14,970 | $3,180 | $11,790 |
| 2015 | $650 | $7,490 | $1,590 | $5,900 |
| 2014 | $553 | $6,180 | $1,150 | $5,030 |
Source: Public Records
Map
Nearby Homes
- 4117 E 98th Place
- 3480 E 100th Ct
- 9749 Albion Ln
- 10157 Garfield Cir
- 4286 E 98th Place
- 9716 Ash Ln
- 4210 E 100th Ave Unit 557
- 4210 E 100th Ave Unit 697
- 4210 E 100th Ave Unit 646
- 4210 E 100th Ave Unit 550
- 4210 E 100th Ave Unit 661
- 4210 E 100th Ave Unit 528
- 9645 Bellaire Ln
- 9730 Clermont Ln
- 4211 E 100th Ave Unit 452
- 10201 Riverdale Rd Unit 63
- 4211 E 100th Ave Unit 465
- 10201 Riverdale Rd Unit 90
- 10201 Riverdale Rd Unit 61
- 10201 Riverdale Rd Unit 187
- 3898 E 99th Cir
- 3889 E 99th Cir
- 3900 E 99th Ln
- 3888 E 99th Cir
- 3910 E 99th Ln
- 3879 E 99th Cir
- 3880 E 99th Ln
- 3878 E 99th Cir
- 3860 E 99th Ln
- 9950 Harrison St
- 9971 Harrison St
- 9981 Harrison St
- 9961 Harrison St
- 3901 E 99th Ln
- 3800 E 99th Ln
- 3881 E 99th Ln
- 3861 E 99th Ln
- 9951 Harrison St
- 3841 E 99th Ln
- 3780 E 99th Ln
Your Personal Tour Guide
Ask me questions while you tour the home.