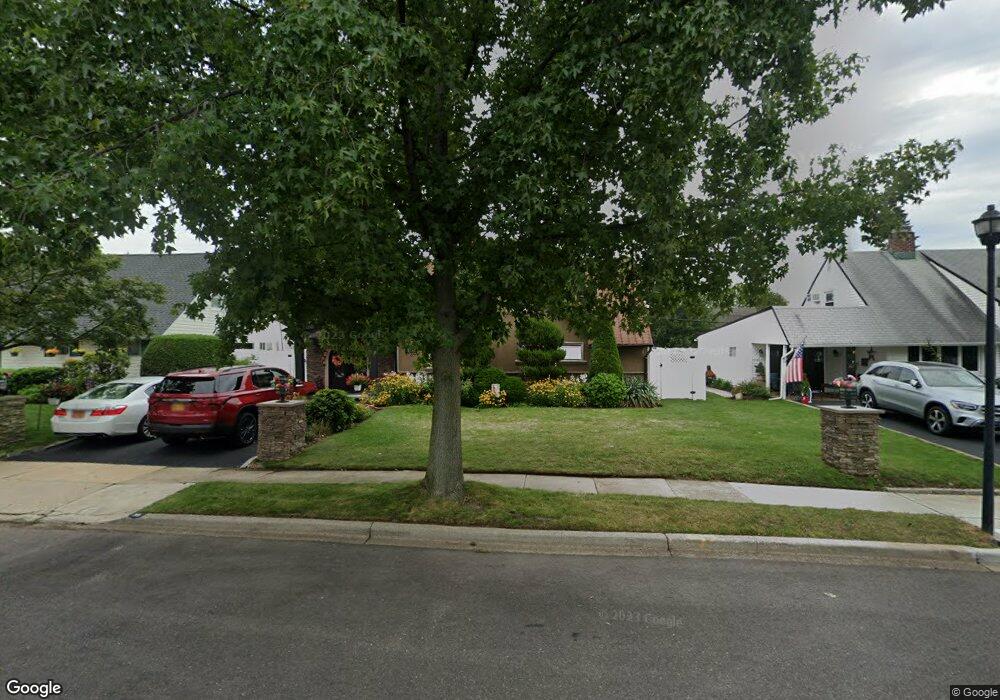
39 Abbey Ln Levittown, NY 11756
Estimated Value: $739,129 - $776,000
Studio
1
Bath
1,876
Sq Ft
$404/Sq Ft
Est. Value
About This Home
This home is located at 39 Abbey Ln, Levittown, NY 11756 and is currently estimated at $757,565, approximately $403 per square foot. 39 Abbey Ln is a home located in Nassau County with nearby schools including Abbey Lane Elementary School, Wisdom Lane Middle School, and Division Avenue Senior High School.
Ownership History
Date
Name
Owned For
Owner Type
Purchase Details
Closed on
Nov 23, 2010
Sold by
Amestegui Sergio
Bought by
Caribe Investors Inc
Current Estimated Value
Home Financials for this Owner
Home Financials are based on the most recent Mortgage that was taken out on this home.
Original Mortgage
$362,123
Outstanding Balance
$241,709
Interest Rate
4.5%
Mortgage Type
FHA
Estimated Equity
$515,856
Purchase Details
Closed on
Aug 29, 2008
Sold by
Robertino Christine
Bought by
Caribe Investors Inc
Create a Home Valuation Report for This Property
The Home Valuation Report is an in-depth analysis detailing your home's value as well as a comparison with similar homes in the area
Home Values in the Area
Average Home Value in this Area
Purchase History
| Date | Buyer | Sale Price | Title Company |
|---|---|---|---|
| Caribe Investors Inc | $367,000 | -- | |
| Caribe Investors Inc | $387,000 | -- | |
| Caribe Investors Inc | $387,000 | Attorney |
Source: Public Records
Mortgage History
| Date | Status | Borrower | Loan Amount |
|---|---|---|---|
| Open | Caribe Investors Inc | $362,123 |
Source: Public Records
Tax History
| Year | Tax Paid | Tax Assessment Tax Assessment Total Assessment is a certain percentage of the fair market value that is determined by local assessors to be the total taxable value of land and additions on the property. | Land | Improvement |
|---|---|---|---|---|
| 2025 | $14,417 | $468 | $221 | $247 |
| 2024 | $3,857 | $468 | $221 | $247 |
Source: Public Records
Map
Nearby Homes
Your Personal Tour Guide
Ask me questions while you tour the home.