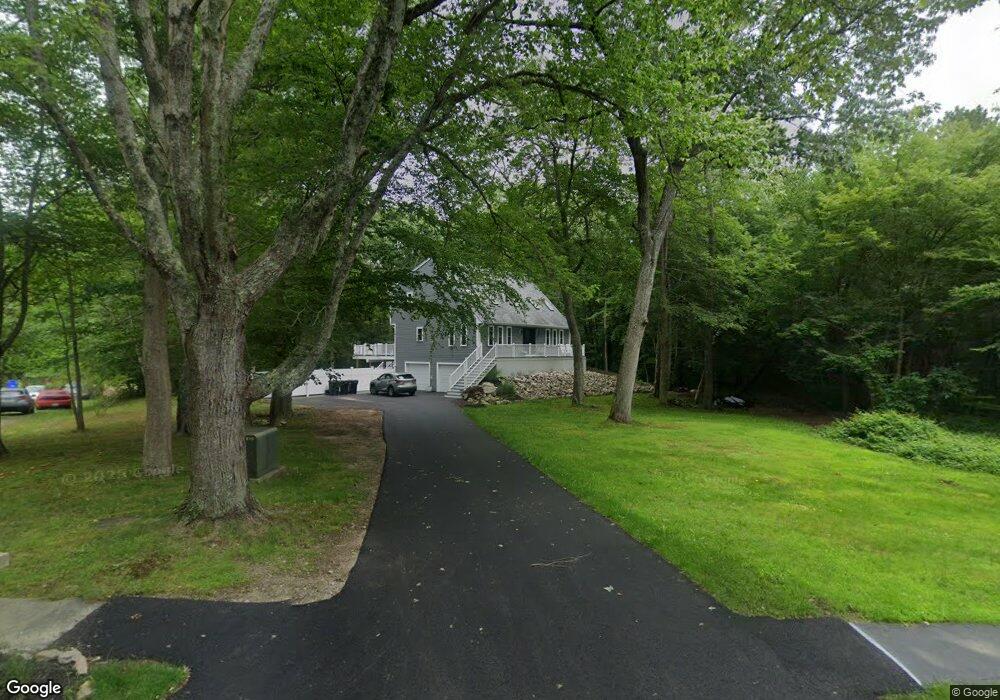
39 Abner Potter Way South Dartmouth, MA 02748
Great Neck NeighborhoodEstimated Value: $580,000 - $698,000
2
Beds
3
Baths
2,130
Sq Ft
$309/Sq Ft
Est. Value
About This Home
This home is located at 39 Abner Potter Way, South Dartmouth, MA 02748 and is currently estimated at $657,484, approximately $308 per square foot. 39 Abner Potter Way is a home located in Bristol County with nearby schools including Dartmouth High School.
Ownership History
Date
Name
Owned For
Owner Type
Purchase Details
Closed on
Oct 25, 2017
Sold by
Amaral Christian A
Bought by
Amaral Christian A and Amaral Connie L
Current Estimated Value
Purchase Details
Closed on
May 21, 2012
Sold by
Amaral Maria A
Bought by
Amaral Christian A
Purchase Details
Closed on
Feb 9, 2011
Sold by
Amaral Christian A and Amaral Connie L
Bought by
Amaral Christian A and Amaral Connie L
Purchase Details
Closed on
Mar 8, 2010
Sold by
Amaral Christian A and Amaral Maria A
Bought by
Amaral Christian A and Amaral Connie L
Purchase Details
Closed on
Jun 12, 2006
Sold by
Barton Bruce E and Barton Doreen R
Bought by
Amaral Christian A and Amaral Maria A
Create a Home Valuation Report for This Property
The Home Valuation Report is an in-depth analysis detailing your home's value as well as a comparison with similar homes in the area
Home Values in the Area
Average Home Value in this Area
Purchase History
| Date | Buyer | Sale Price | Title Company |
|---|---|---|---|
| Amaral Christian A | -- | -- | |
| Amaral Christian A | -- | -- | |
| Amaral Christian A | -- | -- | |
| Amaral Christian A | -- | -- | |
| Amaral Christian A | -- | -- | |
| Amaral Christian A | -- | -- | |
| Amaral Christian A | -- | -- | |
| Amaral Christian A | -- | -- | |
| Amaral Christian A | -- | -- | |
| Amaral Christian A | $399,900 | -- | |
| Amaral Christian A | $399,900 | -- |
Source: Public Records
Mortgage History
| Date | Status | Borrower | Loan Amount |
|---|---|---|---|
| Previous Owner | Amaral Christian A | $50,000 | |
| Previous Owner | Amaral Christian A | $363,000 |
Source: Public Records
Tax History Compared to Growth
Tax History
| Year | Tax Paid | Tax Assessment Tax Assessment Total Assessment is a certain percentage of the fair market value that is determined by local assessors to be the total taxable value of land and additions on the property. | Land | Improvement |
|---|---|---|---|---|
| 2025 | $4,633 | $502,500 | $255,100 | $247,400 |
| 2024 | $4,409 | $476,100 | $236,000 | $240,100 |
| 2023 | $4,443 | $448,800 | $228,400 | $220,400 |
| 2022 | $4,399 | $409,200 | $228,400 | $180,800 |
| 2021 | $4,177 | $375,600 | $212,700 | $162,900 |
| 2020 | $3,996 | $357,400 | $201,600 | $155,800 |
| 2019 | $3,765 | $337,700 | $192,400 | $145,300 |
| 2018 | $3,957 | $359,900 | $210,900 | $149,000 |
| 2017 | $3,772 | $346,700 | $198,900 | $147,800 |
| 2016 | $3,624 | $328,900 | $179,000 | $149,900 |
| 2015 | $3,510 | $319,100 | $167,100 | $152,000 |
| 2014 | $3,410 | $308,900 | $160,000 | $148,900 |
Source: Public Records
Map
Nearby Homes
- 2 Slades Farm Ln
- 1150 Russells Mills Rd
- 73 White Oak Run
- Lot 2E Horseneck Rd
- 99 Sylvia Ln
- 61 Pardon Hill Rd
- 248 Bakerville Rd
- 225 Hixbridge Rd
- 920 Drift Rd
- Lot 2 Horseneck Rd
- Lot 1 Rafael Rd
- 34 Country Way
- 47 Fallon Dr
- 14 Westview Dr
- 24 White Alder Way
- 10 Westview Dr
- 0 Hidden Glen Ln
- 118 Charlotte White Rd Extension
- 75 Country Way Unit 75
- 105 Rock Odundee Rd
- 39 Abner Potter's Way
- 43 Abner Potter Way
- 47 Abner Potter Way
- 38 Abner Potter Way
- 42 Abner Potter Way
- 34 Abner Potter Way
- 46 Abner Potter Way
- 29 Abner Potter Way
- 30 Abner Potter Way
- 46 Abner Potter's Way
- 26 Abner Potter Way
- 25 Abner Potter Way
- 27 Slades Farm Ln
- 50 Abner Potter Way
- 53A Abner Potter Way
- 53C Abner Potter Way
- 55 Abner Potter Way
- 31 Slades Farm Ln
- 22 Abner Potter Way
- 39 Slades Farm Ln