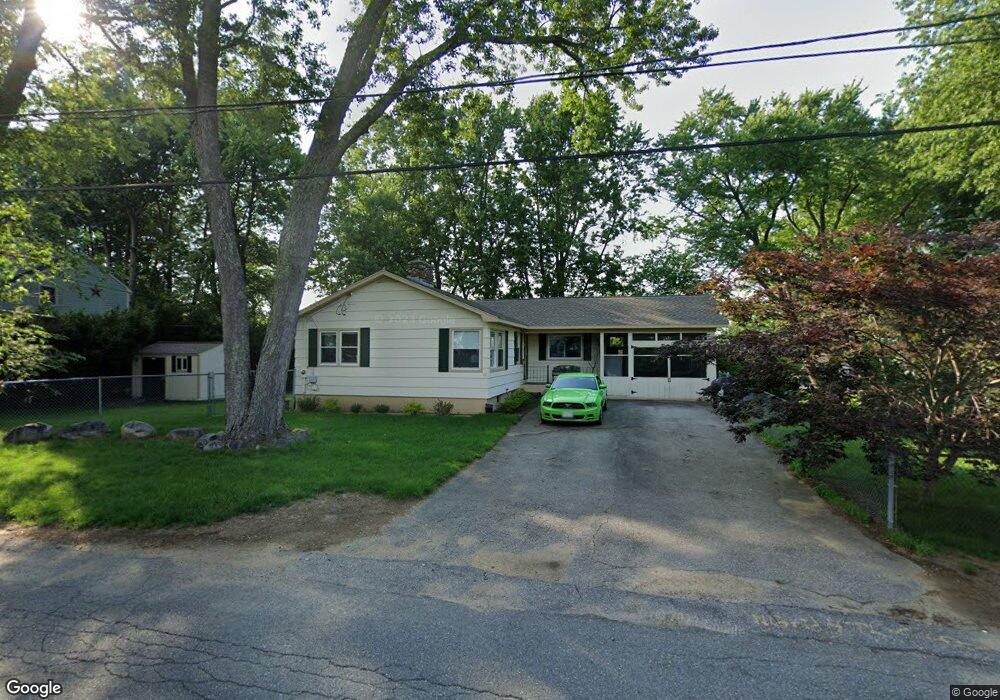
39 Acorn St Haverhill, MA 01832
Broad Hill NeighborhoodEstimated Value: $516,000 - $558,000
3
Beds
2
Baths
1,152
Sq Ft
$464/Sq Ft
Est. Value
About This Home
This home is located at 39 Acorn St, Haverhill, MA 01832 and is currently estimated at $534,969, approximately $464 per square foot. 39 Acorn St is a home located in Essex County with nearby schools including Tilton Elementary School, Consentino Middle School, and Haverhill High School.
Ownership History
Date
Name
Owned For
Owner Type
Purchase Details
Closed on
Oct 31, 2000
Sold by
Wood Craig M and Wood Diane M
Bought by
Megan Timothy and Megan-Srybny Pamela
Current Estimated Value
Purchase Details
Closed on
May 15, 1992
Sold by
Brickyard Rt
Bought by
Marion Luis A and Marion Anny B
Purchase Details
Closed on
Mar 11, 1992
Sold by
Desmarais Jean E
Bought by
Brickyard Rt
Create a Home Valuation Report for This Property
The Home Valuation Report is an in-depth analysis detailing your home's value as well as a comparison with similar homes in the area
Home Values in the Area
Average Home Value in this Area
Purchase History
| Date | Buyer | Sale Price | Title Company |
|---|---|---|---|
| Megan Timothy | $173,000 | -- | |
| Marion Luis A | $122,500 | -- | |
| Brickyard Rt | $41,000 | -- |
Source: Public Records
Mortgage History
| Date | Status | Borrower | Loan Amount |
|---|---|---|---|
| Open | Brickyard Rt | $182,000 | |
| Closed | Brickyard Rt | $80,000 | |
| Closed | Brickyard Rt | $50,000 |
Source: Public Records
Tax History Compared to Growth
Tax History
| Year | Tax Paid | Tax Assessment Tax Assessment Total Assessment is a certain percentage of the fair market value that is determined by local assessors to be the total taxable value of land and additions on the property. | Land | Improvement |
|---|---|---|---|---|
| 2025 | $4,872 | $454,900 | $171,000 | $283,900 |
| 2024 | $4,536 | $426,300 | $167,600 | $258,700 |
| 2023 | $4,420 | $396,400 | $167,600 | $228,800 |
| 2022 | $4,274 | $336,000 | $159,000 | $177,000 |
| 2021 | $4,084 | $303,900 | $141,900 | $162,000 |
| 2020 | $3,915 | $287,900 | $133,400 | $154,500 |
| 2019 | $3,778 | $270,800 | $116,300 | $154,500 |
| 2018 | $3,586 | $251,500 | $109,400 | $142,100 |
| 2017 | $3,686 | $245,900 | $106,000 | $139,900 |
| 2016 | $3,335 | $217,100 | $82,100 | $135,000 |
| 2015 | $3,332 | $217,100 | $82,100 | $135,000 |
Source: Public Records
Map
Nearby Homes