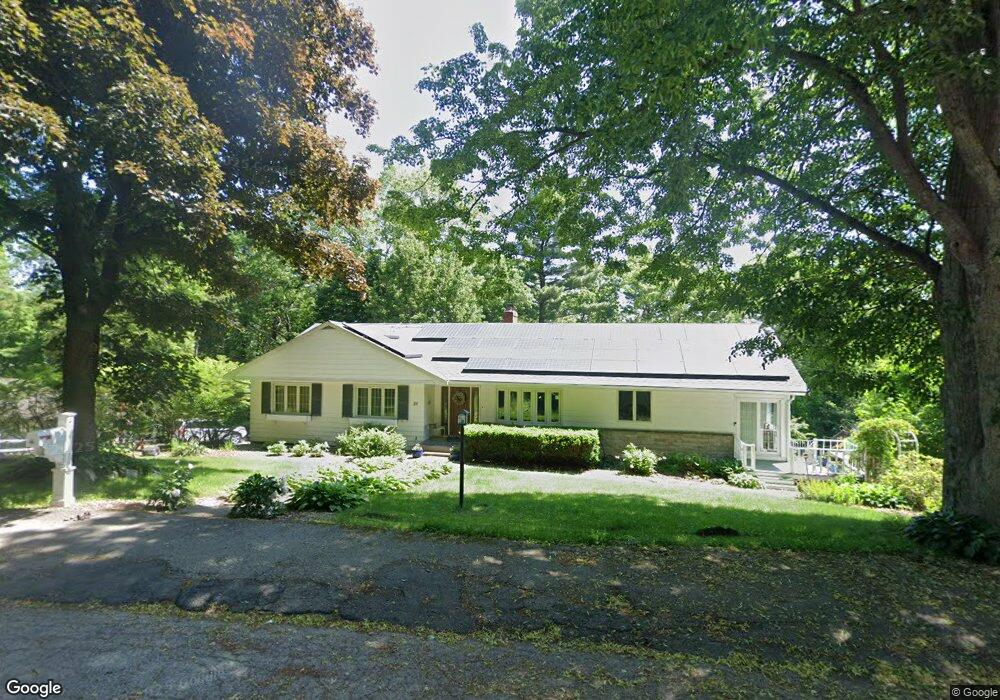
39 Algonquin Rd Canton, MA 02021
Estimated Value: $900,000 - $1,262,000
3
Beds
4
Baths
2,138
Sq Ft
$481/Sq Ft
Est. Value
About This Home
This home is located at 39 Algonquin Rd, Canton, MA 02021 and is currently estimated at $1,027,347, approximately $480 per square foot. 39 Algonquin Rd is a home located in Norfolk County with nearby schools including Canton High School, St. John the Evangelist School, and Beacon Scholastic Academy.
Ownership History
Date
Name
Owned For
Owner Type
Purchase Details
Closed on
Oct 29, 2009
Sold by
Molway Michael and Molway Elizabeth N
Bought by
Molway Elizabeth N
Current Estimated Value
Home Financials for this Owner
Home Financials are based on the most recent Mortgage that was taken out on this home.
Original Mortgage
$75,000
Interest Rate
5.06%
Purchase Details
Closed on
Jun 16, 1997
Sold by
Roach Stewart W and Roach Katheryne N
Bought by
Molway Michael F and Molway Elizabeth N
Create a Home Valuation Report for This Property
The Home Valuation Report is an in-depth analysis detailing your home's value as well as a comparison with similar homes in the area
Home Values in the Area
Average Home Value in this Area
Purchase History
We collect this data history from publicly available records. To have your information removed, we recommend requesting removal directly through your county’s website.
| Date | Buyer | Sale Price | Title Company |
|---|---|---|---|
| Molway Elizabeth N | -- | -- | |
| Molway Michael F | $339,000 | -- |
Source: Public Records
Mortgage History
We collect this data history from publicly available records. To have your information removed, we recommend requesting removal directly through your county’s website.
| Date | Status | Borrower | Loan Amount |
|---|---|---|---|
| Open | Molway Michael F | $210,000 | |
| Closed | Molway Michael F | $75,000 | |
| Previous Owner | Molway Michael F | $210,000 |
Source: Public Records
Tax History
| Year | Tax Paid | Tax Assessment Tax Assessment Total Assessment is a certain percentage of the fair market value that is determined by local assessors to be the total taxable value of land and additions on the property. | Land | Improvement |
|---|---|---|---|---|
| 2025 | $8,082 | $817,200 | $372,100 | $445,100 |
| 2024 | $7,908 | $793,200 | $357,800 | $435,400 |
| 2023 | $7,788 | $736,800 | $357,800 | $379,000 |
| 2022 | $7,632 | $672,400 | $340,700 | $331,700 |
| 2021 | $7,458 | $611,300 | $309,700 | $301,600 |
| 2020 | $7,245 | $592,400 | $295,000 | $297,400 |
| 2019 | $7,094 | $572,100 | $268,100 | $304,000 |
| 2018 | $7,087 | $570,600 | $268,600 | $302,000 |
| 2017 | $7,160 | $559,800 | $263,300 | $296,500 |
| 2016 | $7,435 | $581,300 | $287,700 | $293,600 |
| 2015 | $7,259 | $566,200 | $279,400 | $286,800 |
Source: Public Records
Map
Nearby Homes
- 49 Algonquin Rd
- 2253 Washington St Unit 1
- 2067 Washington St
- 1 Ridgehill Rd
- 35 Turnpike St
- 130 University Ave Unit 1312
- 39 Birchcroft Rd
- 10 Peartree Dr
- 39 Peartree Dr
- 1066 Hillside St
- 12 Barbara Rd
- 4 Flintlock Ln
- 243 Weatherbee Dr
- 215 Blue Hill Dr
- 193 Vincent Rd
- 12 Pleasant Cir
- 130 Gainsville Rd
- 124 Gainsville Rd
- 20 Bonney Ln
- 7 Evergreen Cir
Your Personal Tour Guide
Ask me questions while you tour the home.