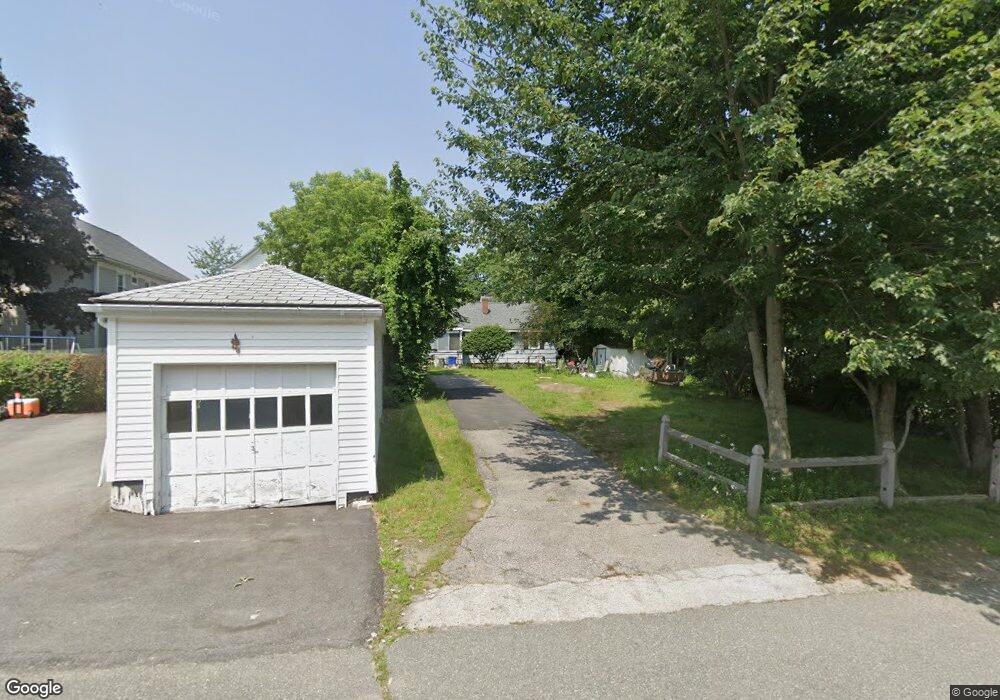
39 Altamont St Haverhill, MA 01832
Broad Hill NeighborhoodEstimated Value: $447,719 - $503,000
2
Beds
1
Bath
875
Sq Ft
$540/Sq Ft
Est. Value
About This Home
This home is located at 39 Altamont St, Haverhill, MA 01832 and is currently estimated at $472,680, approximately $540 per square foot. 39 Altamont St is a home located in Essex County with nearby schools including Tilton Elementary School and Silver Hill Elementary School.
Ownership History
Date
Name
Owned For
Owner Type
Purchase Details
Closed on
Sep 1, 2000
Sold by
Shellene Darlene
Bought by
Alvino Christopher M and Alvino Anthony
Current Estimated Value
Purchase Details
Closed on
Jan 20, 1989
Sold by
Dibenedetto Peter L
Bought by
Shellene Darlene
Purchase Details
Closed on
Apr 20, 1988
Sold by
Labrecque John W
Bought by
Dibenedetto Peter L
Create a Home Valuation Report for This Property
The Home Valuation Report is an in-depth analysis detailing your home's value as well as a comparison with similar homes in the area
Home Values in the Area
Average Home Value in this Area
Purchase History
| Date | Buyer | Sale Price | Title Company |
|---|---|---|---|
| Alvino Christopher M | $133,000 | -- | |
| Shellene Darlene | $105,000 | -- | |
| Dibenedetto Peter L | $96,000 | -- |
Source: Public Records
Mortgage History
| Date | Status | Borrower | Loan Amount |
|---|---|---|---|
| Open | Dibenedetto Peter L | $175,150 | |
| Closed | Dibenedetto Peter L | $50,000 |
Source: Public Records
Tax History Compared to Growth
Tax History
| Year | Tax Paid | Tax Assessment Tax Assessment Total Assessment is a certain percentage of the fair market value that is determined by local assessors to be the total taxable value of land and additions on the property. | Land | Improvement |
|---|---|---|---|---|
| 2025 | $3,887 | $362,900 | $154,300 | $208,600 |
| 2024 | $3,639 | $342,000 | $151,200 | $190,800 |
| 2023 | $3,564 | $319,600 | $151,200 | $168,400 |
| 2022 | $3,503 | $275,400 | $143,500 | $131,900 |
| 2021 | $3,343 | $248,700 | $128,000 | $120,700 |
| 2020 | $3,203 | $235,500 | $120,300 | $115,200 |
| 2019 | $3,070 | $220,100 | $104,900 | $115,200 |
| 2018 | $2,919 | $204,700 | $98,700 | $106,000 |
| 2017 | $2,989 | $199,400 | $95,600 | $103,800 |
| 2016 | $2,679 | $174,400 | $74,000 | $100,400 |
| 2015 | $2,677 | $174,400 | $74,000 | $100,400 |
Source: Public Records
Map
Nearby Homes
- 5 Sherman Ave
- 16 Standish Rd
- 99 Blaisdell St Unit C
- 97-99 Blaisdell St Unit 2
- 19 Greenhill Farm Rd
- 2 N Broadway
- 83 Standish Rd
- 40 Bellevue Ave Unit 42
- 110 Pilling St
- 43 Boston St Unit 43
- 39 Boston St Unit 39
- 23 Lewis St
- 291 Broadway Unit D
- 11 York St Unit 11
- 9 York St Unit 9
- 134 Warrenton Rd
- 5 Kimball St
- 192 Franklin St
- 114 N Broadway
- 54 Observatory Ave
- 37 Altamont St
- 51 Altamont St
- 35 Altamont St
- 16 Altamont St
- 16 Altamont St Unit 3
- 16 Altamont St Unit 2
- 16 Altamont St Unit 1
- 20 Woodcock Ave
- 33 Altamont St
- 4 Woodcock Ave
- 22 Altamont St
- 53 Altamont St
- 2 Woodcock Ave
- 14 Altamont St
- 55 Altamont St
- 56 Altamont St
- 19 Woodcock Ave
- 13 Woodcock Ave
- 1-3 Woodcock Ave
- 57 Altamont St