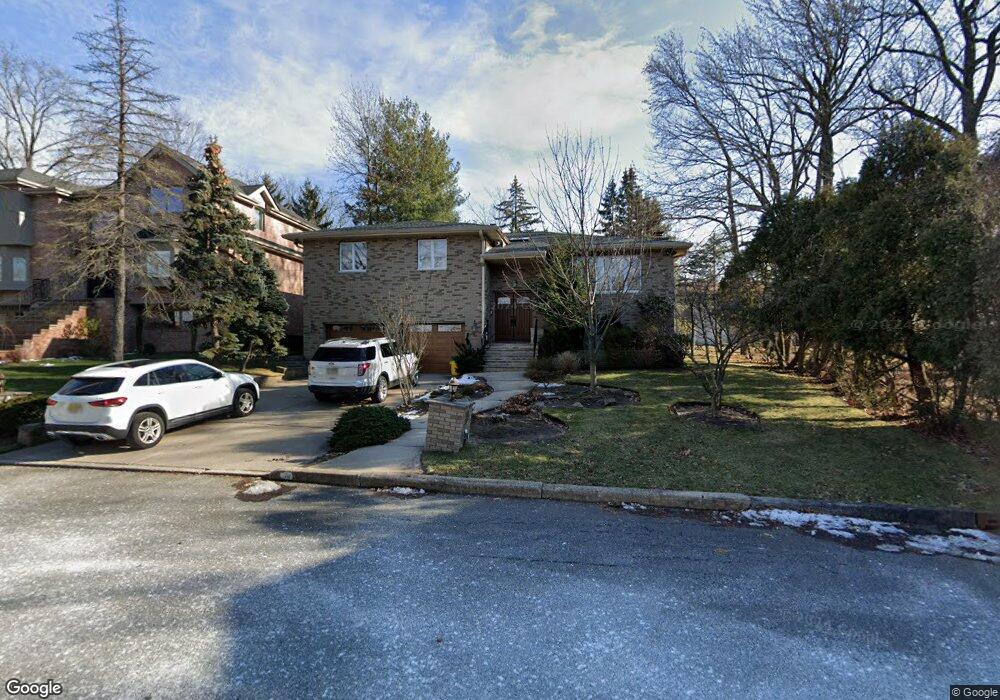
39 Anderson Ave Englewood Cliffs, NJ 07632
Estimated Value: $1,267,508 - $1,544,000
--
Bed
--
Bath
3,640
Sq Ft
$399/Sq Ft
Est. Value
About This Home
This home is located at 39 Anderson Ave, Englewood Cliffs, NJ 07632 and is currently estimated at $1,450,877, approximately $398 per square foot. 39 Anderson Ave is a home located in Bergen County with nearby schools including North Cliff Elementary School, Upper School Elementary School, and Christ the Teacher Academy.
Ownership History
Date
Name
Owned For
Owner Type
Purchase Details
Closed on
Dec 27, 2017
Sold by
Est Garritano Rita and Garritano Ex Rita
Bought by
Garritano Andrew and Garritano Raffaela
Current Estimated Value
Home Financials for this Owner
Home Financials are based on the most recent Mortgage that was taken out on this home.
Original Mortgage
$615,000
Outstanding Balance
$518,456
Interest Rate
3.9%
Mortgage Type
Purchase Money Mortgage
Estimated Equity
$932,421
Purchase Details
Closed on
Aug 12, 2016
Sold by
Carroccia Albert and Geraczynski Christine C
Bought by
Garritano Rita and Garritano Pasquale
Purchase Details
Closed on
Sep 17, 2003
Create a Home Valuation Report for This Property
The Home Valuation Report is an in-depth analysis detailing your home's value as well as a comparison with similar homes in the area
Home Values in the Area
Average Home Value in this Area
Purchase History
| Date | Buyer | Sale Price | Title Company |
|---|---|---|---|
| Garritano Andrew | $930,000 | -- | |
| Garritano Rita | -- | Attorney | |
| -- | -- | -- |
Source: Public Records
Mortgage History
| Date | Status | Borrower | Loan Amount |
|---|---|---|---|
| Open | Garritano Andrew | $615,000 |
Source: Public Records
Tax History Compared to Growth
Tax History
| Year | Tax Paid | Tax Assessment Tax Assessment Total Assessment is a certain percentage of the fair market value that is determined by local assessors to be the total taxable value of land and additions on the property. | Land | Improvement |
|---|---|---|---|---|
| 2025 | $9,897 | $856,900 | $593,000 | $263,900 |
| 2024 | $9,777 | $856,900 | $593,000 | $263,900 |
| 2023 | $9,623 | $856,900 | $593,000 | $263,900 |
| 2022 | $9,623 | $856,900 | $593,000 | $263,900 |
| 2021 | $7,398 | $856,900 | $593,000 | $263,900 |
| 2020 | $9,863 | $856,900 | $593,000 | $263,900 |
| 2019 | $9,263 | $856,900 | $593,000 | $263,900 |
| 2018 | $8,937 | $856,900 | $593,000 | $263,900 |
| 2017 | $8,552 | $856,900 | $593,000 | $263,900 |
| 2016 | $8,389 | $856,900 | $593,000 | $263,900 |
| 2015 | $7,969 | $856,900 | $593,000 | $263,900 |
| 2014 | $7,455 | $856,900 | $593,000 | $263,900 |
Source: Public Records
Map
Nearby Homes