Estimated Value: $107,529 - $193,000
--
Bed
1
Bath
1,145
Sq Ft
$143/Sq Ft
Est. Value
About This Home
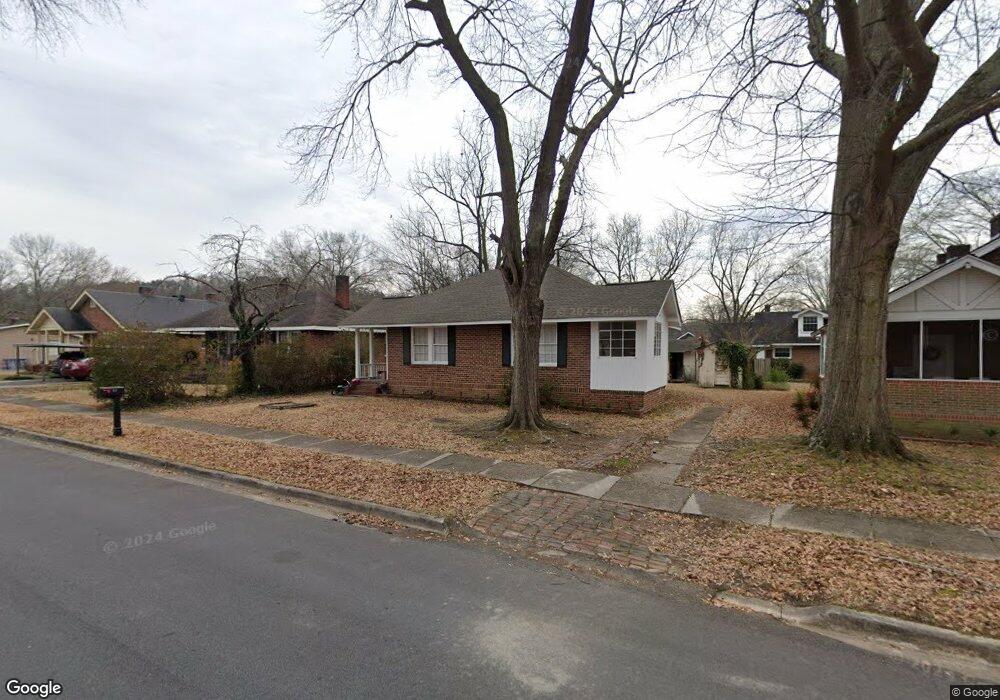
This home is located at 39 Ash St NE, Rome, GA 30161 and is currently estimated at $164,132, approximately $143 per square foot. 39 Ash St NE is a home located in Floyd County with nearby schools including Model Middle School, Model High School, and Unity Christian School.
Ownership History
Date
Name
Owned For
Owner Type
Purchase Details
Closed on
Aug 3, 2010
Sold by
Mcgaskey Betty L
Bought by
Moss Robert L
Current Estimated Value
Purchase Details
Closed on
Jun 2, 2001
Sold by
Mcgaskey Jimmy L and Mcgaskey Betty L
Bought by
Mcgaskey Betty L
Purchase Details
Closed on
Feb 10, 2000
Sold by
Stuenkel Lisa D and Lyon Jane K
Bought by
Mcgaskey Jimmy L and Mcgaskey Betty L
Purchase Details
Closed on
May 18, 1999
Bought by
P and R
Purchase Details
Closed on
Feb 5, 1990
Sold by
Atkins Jeanette M
Bought by
Atkins Jeanette M
Purchase Details
Closed on
May 25, 1989
Sold by
West Jeanette Atkins
Bought by
Atkins Jeanette M
Purchase Details
Closed on
Jan 2, 1901
Sold by
Atkins Benjamin F and Atkins Jeanette M
Bought by
Remarried
Purchase Details
Closed on
Jan 1, 1901
Bought by
Atkins Benjamin F and Atkins Jeanette M
Create a Home Valuation Report for This Property
The Home Valuation Report is an in-depth analysis detailing your home's value as well as a comparison with similar homes in the area
Home Values in the Area
Average Home Value in this Area
Purchase History
| Date | Buyer | Sale Price | Title Company |
|---|---|---|---|
| Moss Robert L | $18,000 | -- | |
| Mcgaskey Betty L | -- | -- | |
| Mcgaskey Jimmy L | $59,900 | -- | |
| P | $47,500 | -- | |
| Stuenkel Lisa D | -- | -- | |
| Stephen Atkins Michael | -- | -- | |
| P | -- | -- | |
| Atkins Jeanette M | -- | -- | |
| Atkins Jeanette M | -- | -- | |
| Remarried | -- | -- | |
| Atkins Benjamin F | -- | -- |
Source: Public Records
Tax History Compared to Growth
Tax History
| Year | Tax Paid | Tax Assessment Tax Assessment Total Assessment is a certain percentage of the fair market value that is determined by local assessors to be the total taxable value of land and additions on the property. | Land | Improvement |
|---|---|---|---|---|
| 2024 | $1,129 | $38,133 | $9,293 | $28,840 |
| 2023 | $967 | $38,133 | $9,293 | $28,840 |
| 2022 | $894 | $28,825 | $7,603 | $21,222 |
| 2021 | $827 | $26,158 | $7,603 | $18,555 |
| 2020 | $741 | $23,177 | $5,808 | $17,369 |
| 2019 | $676 | $21,404 | $5,808 | $15,596 |
| 2018 | $640 | $20,222 | $5,808 | $14,414 |
| 2017 | $621 | $19,534 | $5,808 | $13,726 |
| 2016 | $644 | $20,056 | $6,600 | $13,456 |
| 2015 | $562 | $22,696 | $2,720 | $19,976 |
| 2014 | $562 | $18,397 | $2,720 | $15,677 |
Source: Public Records
Map
Nearby Homes
- 23 Oak St NE
- 27 Oak St NE
- 42 Dogwood St NE
- 40 Dogwood St NE
- 208 Chatillon Rd NE
- 1 Fir St NE
- 7 Ash St NE
- 0 Cypress St NE Unit 7494593
- 0 Cypress St NE Unit 10422946
- 0 Euclid Ave Unit 10617853
- 205 Couper St NE
- 311 Reynolds St NE
- 411 Woodward St NE
- 219 North Ave NE
- 541 Reece St NE
- 4 N Haven Dr
- 302 Tolbert St
- 17 Joplin St NE
- 2 Lindberg Dr NE