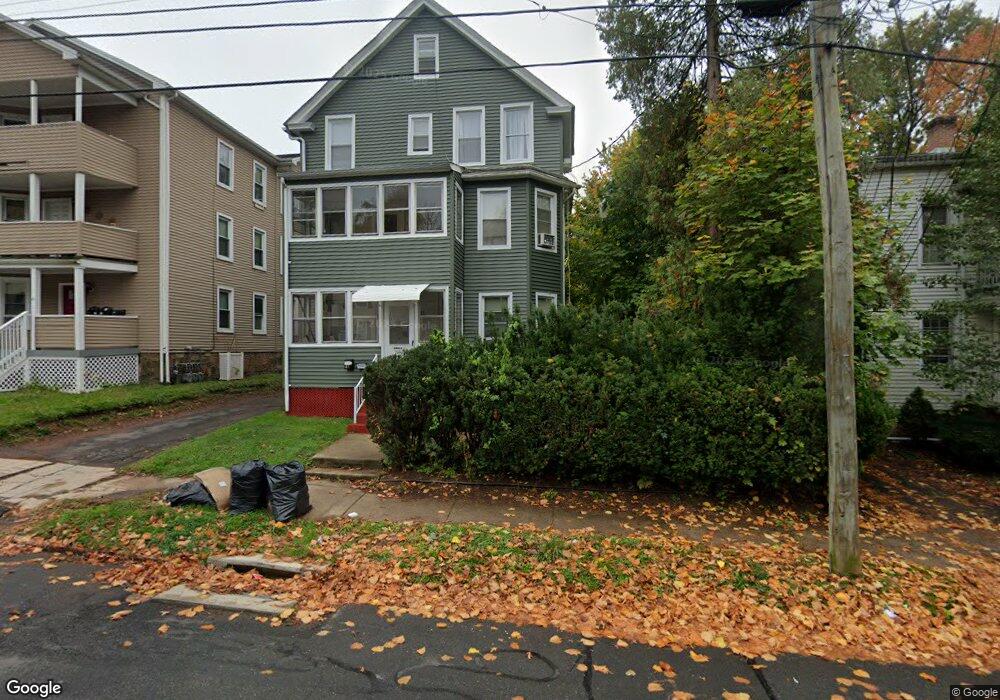
39 Austin St New Britain, CT 06051
Estimated Value: $302,838 - $432,000
7
Beds
3
Baths
2,515
Sq Ft
$154/Sq Ft
Est. Value
About This Home
This home is located at 39 Austin St, New Britain, CT 06051 and is currently estimated at $388,460, approximately $154 per square foot. 39 Austin St is a home located in Hartford County with nearby schools including Slade Middle School and Mountain Laurel Sudbury School.
Ownership History
Date
Name
Owned For
Owner Type
Purchase Details
Closed on
Jul 22, 2020
Sold by
Gebeloff Marc
Bought by
Milus Louis
Current Estimated Value
Purchase Details
Closed on
Oct 30, 2009
Sold by
Gebeloff-Bruyette Linda
Bought by
Gebeloff Marc
Purchase Details
Closed on
Oct 9, 2009
Sold by
Osorno Argemiro J
Bought by
Bank Of America Na
Purchase Details
Closed on
Jun 16, 2006
Sold by
Biedrzycki Krzysztof
Bought by
Osorno Argemiro J
Home Financials for this Owner
Home Financials are based on the most recent Mortgage that was taken out on this home.
Original Mortgage
$208,065
Interest Rate
6.62%
Purchase Details
Closed on
Nov 27, 2002
Sold by
Liberty Rlty Inv Llc
Bought by
Biedrzycki Krzysztof
Home Financials for this Owner
Home Financials are based on the most recent Mortgage that was taken out on this home.
Original Mortgage
$132,900
Interest Rate
6.16%
Create a Home Valuation Report for This Property
The Home Valuation Report is an in-depth analysis detailing your home's value as well as a comparison with similar homes in the area
Home Values in the Area
Average Home Value in this Area
Purchase History
| Date | Buyer | Sale Price | Title Company |
|---|---|---|---|
| Milus Louis | $183,000 | None Available | |
| Gebeloff Marc | -- | -- | |
| Gebeloff-Bruyette Linda | $67,000 | -- | |
| Bank Of America Na | -- | -- | |
| Osorno Argemiro J | $214,500 | -- | |
| Biedrzycki Krzysztof | $135,000 | -- |
Source: Public Records
Mortgage History
| Date | Status | Borrower | Loan Amount |
|---|---|---|---|
| Previous Owner | Biedrzycki Krzysztof | $208,065 | |
| Previous Owner | Biedrzycki Krzysztof | $132,900 |
Source: Public Records
Tax History Compared to Growth
Tax History
| Year | Tax Paid | Tax Assessment Tax Assessment Total Assessment is a certain percentage of the fair market value that is determined by local assessors to be the total taxable value of land and additions on the property. | Land | Improvement |
|---|---|---|---|---|
| 2025 | $6,994 | $178,500 | $48,370 | $130,130 |
| 2024 | $7,067 | $178,500 | $48,370 | $130,130 |
| 2023 | $6,833 | $178,500 | $48,370 | $130,130 |
| 2022 | $4,747 | $95,900 | $22,260 | $73,640 |
| 2021 | $4,747 | $95,900 | $22,260 | $73,640 |
| 2020 | $4,843 | $95,900 | $22,260 | $73,640 |
| 2019 | $4,843 | $95,900 | $22,260 | $73,640 |
| 2018 | $4,843 | $95,900 | $22,260 | $73,640 |
| 2017 | $4,596 | $91,000 | $22,260 | $68,740 |
| 2016 | $4,596 | $91,000 | $22,260 | $68,740 |
| 2015 | $4,459 | $91,000 | $22,260 | $68,740 |
| 2014 | $4,459 | $91,000 | $22,260 | $68,740 |
Source: Public Records
Map
Nearby Homes