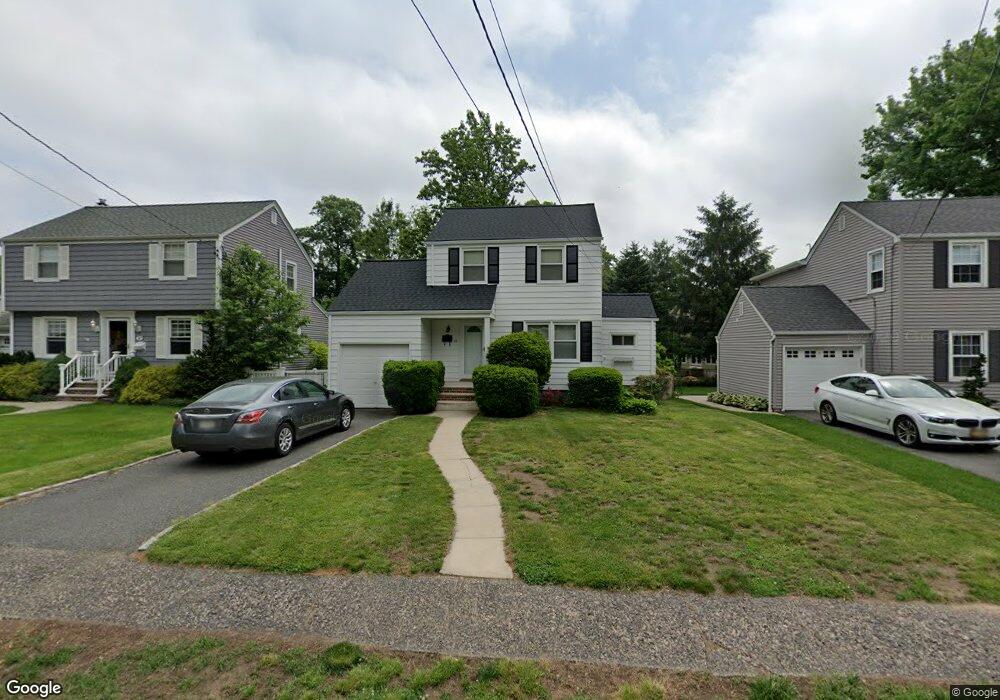
39 Barnett St Bloomfield, NJ 07003
Estimated Value: $529,010 - $622,000
Studio
--
Bath
1,164
Sq Ft
$487/Sq Ft
Est. Value
About This Home
This home is located at 39 Barnett St, Bloomfield, NJ 07003 and is currently estimated at $567,253, approximately $487 per square foot. 39 Barnett St is a home located in Essex County with nearby schools including Oak View School, Bloomfield Middle School, and Bloomfield High School.
Ownership History
Date
Name
Owned For
Owner Type
Purchase Details
Closed on
May 3, 2021
Sold by
39 Barnett Llc
Bought by
Diaz Vela Jim and Maldonado Manuel
Current Estimated Value
Home Financials for this Owner
Home Financials are based on the most recent Mortgage that was taken out on this home.
Original Mortgage
$308,750
Outstanding Balance
$279,805
Interest Rate
3.1%
Mortgage Type
New Conventional
Estimated Equity
$287,448
Purchase Details
Closed on
Mar 1, 2021
Sold by
Caruso Christopher
Bought by
39 Barnett Llc
Create a Home Valuation Report for This Property
The Home Valuation Report is an in-depth analysis detailing your home's value as well as a comparison with similar homes in the area
Home Values in the Area
Average Home Value in this Area
Purchase History
| Date | Buyer | Sale Price | Title Company |
|---|---|---|---|
| Diaz Vela Jim | $325,000 | Ridge Title Agency Llc | |
| 39 Barnett Llc | $225,000 | Evident Title |
Source: Public Records
Mortgage History
| Date | Status | Borrower | Loan Amount |
|---|---|---|---|
| Open | Diaz Vela Jim | $308,750 |
Source: Public Records
Tax History
| Year | Tax Paid | Tax Assessment Tax Assessment Total Assessment is a certain percentage of the fair market value that is determined by local assessors to be the total taxable value of land and additions on the property. | Land | Improvement |
|---|---|---|---|---|
| 2025 | $10,621 | $325,000 | $202,700 | $122,300 |
| 2024 | $10,621 | $325,000 | $202,700 | $122,300 |
Source: Public Records
Map
Nearby Homes
- 3 Collins Ave
- 330 W Passaic Ave
- 1 Rutan Place
- 355 W Passaic Ave
- 147 Knollwood Terrace
- 30 Andover Place
- 80 Rhoda Ave
- 18 Farmingdale Ave
- 96 Orchard Dr
- 1552 Broad St Rear
- 171 Sadler Rd
- 45 Marlboro Rd
- 49 New Brier Ln
- 1169 Broad St
- 23 Sussex Rd
- 5 Bellevue Ave
- 93 Bromley Place
- 31 Emily Ave
- 10 Burlington Rd
- 9 Pierson St
Your Personal Tour Guide
Ask me questions while you tour the home.